1. Home > 
  2. Stock Photos > 
  3. Digital Financial Data Display Screen with Analytics

Digital Financial Data Display Screen with Analytics Image

Digital Financial Data Display Screen with Analytics

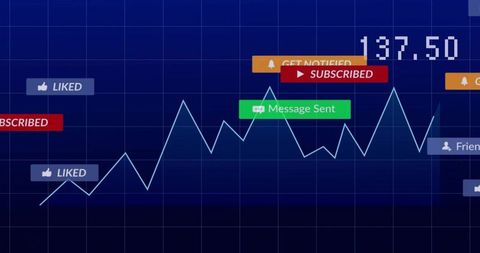
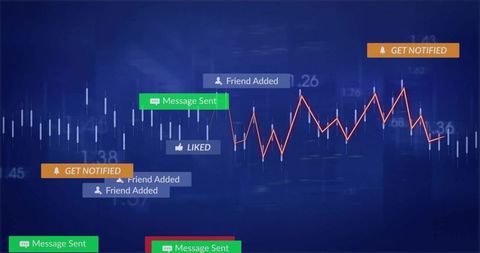
Detailed display of financial analytics showing charts and statistic percentages on dark screen. Ideal for illustrating concepts of global business, economics, and data-driven decision making. Useful in presentations about financial technology, data processing, and business strategy.

Powered by Shutterstock logo - Get 15% off with code: PIKWIZARD15
Man look at the dashboard with graphs and charts. Concept of data management system, business intelligence, data statistics, marketing analysis, key performance indicators (KPI) and analytics. - Powered by Shutterstock - Get 15% off with code: PIKWIZARD15Businessman using KPI dashboard.Financial business KPI System data analytics graph dashboard.Data System KPI and metrics connected in database for follow earnings,operations and sales data. - Powered by Shutterstock - Get 15% off with code: PIKWIZARD15Business analytic with tablet pc and laptop computer - Powered by Shutterstock - Get 15% off with code: PIKWIZARD15Internet cyberspace data information collection analytical statistics computer storage ai artificial intelligence calculation, blue background banner copyspace. - Powered by Shutterstock - Get 15% off with code: PIKWIZARD15Analyst working with Financial Report and Business Analytics Dashboard on laptop computer to analyze Financial Data with KPI and Metrics. Investment, Operations, Sales, Corporate Finance, Strategy. - Powered by Shutterstock - Get 15% off with code: PIKWIZARD15

Credit Photo

If you would like to credit the Photo, here are some ways you can do so

Free (free of charge)

Free for personal and commercial use.

Author: Awesome Content

Similar Free Stock Images

Dynamic Financial Data Display in Digital Space
Premium
Stock market or forex trading graph on touchscreen,  finance and investment concept. Economy trends for business, financial charts and digits.
Abstract Stock Market Data with Graphs and Numbers
Digital Stock Market Trends and Financial Growth Analysis
Digital Interface with Data Graphs and Charts
Financial Chart and Rotating Globe on Digital Grid Background
Premium
Big data analytics with AI technology. Data analyst analyzing and visualizing complex information network with artificial intelligence. Machine learning algorithm for business analytics and finance.
Digital Graph Interface with Glowing Data and Readings
Digital Stock Market Data and Analytics on Screen
Digital Financial Data Display with Graphs and Analytics
Stock Market Data Visualization Overlay Arena Shows Global Financial Analytics
Premium
work hard Data Analytics Statistics Information Business Technology
Optimized Statistical Data Overlain on Corporate Architecture
Data Security with Tech Bar Graph Overlay
Financial Data Processing with Digital Patterns for Global Business
Digital Financial Data Overlay on Urban Street Scene
Premium
Dashboard finance management on laptop computer analyzing sales data and growth graph chart report. Business planning, strategy and development. Financial accounting. market research, data analysis
Digital Finance Network with User Profiles and Graphs
Futuristic Data Visualization in Financial Markets
Financial Graphs with Social Media Analytics on Digital Chart
Dynamic Financial Data Visualization on Digital Grid Background
Premium
Hand holding smartphone displays data visualizations, including histogram and pie chart. Analytics, digital transformation and increasing use of mobile technology in business. Minimalist art collage.
Stock Market Analysis Digital Screen with Graphs and Trends
Digital Cityscape with Financial Data Overlay
Soundwave Visualization and Data Analysis on Digital Grid
Abstract Financial Data Visualization with Graphs and Grid Background
Premium
Man look at the dashboard with graphs and charts. Concept of data management system, business intelligence, data statistics, marketing analysis, key performance indicators (KPI) and analytics.
Digital Interface Visualizing DNA and Data Patterns
Dynamic Financial Graph with Data Analysis Conceptual Background
Futuristic Digital Console with Graphs and Data Visualizations
Dashboard with Data Graph and Alerts for Analytics Insights
Digital Finance Data Overlaying Futuristic Cityscape
Digital Financial Data Interface with Analytics
Premium
Businessman analyzing a business analytics (BA) or intelligence (BI) dashboard on virtual screen showing sales and operations data statistics charts and key performance indicators (KPI)
Dynamic Financial Data Overlaying Urban Cityscape
Digital Interface with Virtual Data Surging Across Connection Globes
Financial Data Flow against Urban Skyline Backdrop
Dynamic Green Stock Chart on Digital Grid Background
Premium
Financial advisor explaining invest stock market data consulting investor. Two busy business men analysts doing finance trading analysis pointing at exchange chart on laptop screen working in office.
Digital Finance: Modern Stock Market Analysis Display
Digital Financial Dashboard with Graphs and Data Visualization
Digital Interface Displaying Stock Market Data and Statistics
Financial Data Display in Digital Grid Design
Premium
Stockmarket online trading chart candlestick on crypto currency platform. Stock exchange financial market price candles graph data pattern analysis concept. Computer screen closeup background
Digital Financial Data Analysis with Graphs and Stock Market Trends
Financial Data Overlay on Urban Skyscrapers
Dynamic Business Analysis with Global Digital Interface Figures
Abstract Financial Market Data with CGI and Code Overlay
Premium
Business finance data analytics graph.Financial management technology.Advisor using KPI Dashboard on virtual screen.
Cryptocurrency Trends and Data Visualization Concept
Global Financial Trends and Digital Data Visualization Concepts
Abstract Digital Charts with Social Media Metrics Rising
Dynamic Financial Graphs and Data Analysis Interface
Premium
Businessman using tablet Analytics Data KPI Dashboard Tech with charts, metrics, and KPI to analyze performance and create insight reports for operations management.Data mining.Data analysis.Ai
Global Financial Data Visualization with Digital Overlays
Advanced Data Processing with Graphs and Futuristic Network Overlay
Dynamic Financial Data Overlaid on Grid Background
Financial Data Analysis with Growing Stock Trends
Premium
Big data technology and data science with person touching data flowing on virtual screen. Business analytics, artificial intelligence, machine learning. Engineer or scientist analyzing stream of data.
Dynamic Graphs and Charts on Technology Background
Futuristic Data Chart on Digital Dashboard with Modern Interface
Digital Code Interface with Graphs on Blue Background
Dynamic Stock Market Trends with Graphs on Digital Display
Financial Data Displayed Over City Skyline with Rising Graphs
Digital Financial Data and Global Business Analytics
Premium
Big data technology and data science. Data scientist querying, analysing and visualizing complex set on virtual screen. Data flow concept. Neural network, artificial intelligence, ML, analytics.
Financial Data Charts with World Map on Blue Digital Background
Data Recovery Progress Display on Digital Interface
Rising Digital Graph and Data Visualizations on Black Background
Financial Stock Market Data Analysis on Digital Interface
Premium
Strategizing Wealth Management: Close-up of Hands Holding Financial Data amidst Office Desktop Dynamics
Digital Financial Display with Graphs and Data Analysis
Digital Ruble Symbol with Data Graph Overlay
Dynamic Data Visualization with Businesspeople Walk
Diverse Team Analyzing Business Market Trends with Technology
Premium
Male coach hold seminar for staff, makes presentation, provides sales statistics explanation gathered in modern conference room, with monitor screen with infographic charts, graphs and diagrams data
Dynamic Financial Growth Digital Chart Display
Rising Graphs and Interactive Financial Data Analytics Background
Holographic Charts with Social Media Notifications
Financial Graphs Overlaying Industrial Junkyard
Premium
Analyst team use sticky note for creative and analytic brainstorm for business idea with BI data dashboard on laptop screen. Analysis financial data visualization tech for marketing strategy. Prodigy
Rising Financial Data Graph on Digital Grid Background
Statistical Data and Trends Over Digital Grid Overlay
Digital Chart Display Financial Data Analysis Background Effects
Abstract Digital Stock Market Analysis with Graphs
Premium
Young indian business man trader wearing glasses looking at computer screen with trading charts reflecting in eyeglasses watching stock trading market financial data growth concept, close up.
Stock Market Graph with Social Media Notifications Overlay
Futuristic Graph and Data Technology Interface
Abstract Financial Data Processing and Analysis Interface
Digital Visualization of Global Networking with Statistical Graphs
Premium
Trader analyzing data on virtual screen.Price graph and indicator. Stock market invest and crypto currency. Stock market and business investment.
Futuristic Data Analytics Dashboard with Graphs and Code Interface
Neon Analytics Dashboard Showing Rising Blue Trend Line, Red Volatility, Dotted Bars
Dynamic Digital Stock Market Ticker with Growing Graph Trends
Digital DNA Strand Visualization on Modern Interface Background
Financial Data Visualization Over Futuristic Cityscape
Dynamic Digital Data Analysis on Elevated Grid
Premium
Businessman using laptop computer analyzing sales data and financial growth graph chart report. Business planning, strategy and development. Financial accounting. market research, data analysis
Financial Visualization Overlooking Urban Cityscape
Digital Graph Interface on Global Technology Background
Digital Graphs Over Cityscape Representing Global Business Growth
Financial Data Charts in Shimmering Blue Digital Space
Premium
Analyst working with Financial Data and Business Analytics Dashboard on computer to make Financial Report with KPI and Metrics. Investment, Corporate Finance, Strategy, Operations, Sales.
Dynamic Financial Data and Graphs on Digital Interface
Digital Financial Data Interface on Green Background
Abstract Digital Interface for Medical Data Processing
Dynamic Financial Charts and Graphs Indicating Market Trends
Premium
Data analysis, business meeting or woman with graph presentation in office for revenue, profit or sale statistics. Chart, analytics or accounting mentor brainstorming economy, inflation or solution
Dynamic Business Data and Cityscape Visualization
Digital Data Visualization with Trend Lines and Percentage Changes
Financial Growth Graph and Data Analytics Representation
Dynamic Statistical Data Analysis on Digital Grid Network
Premium
Businessman Working Dashboard Strategy Research Concept
Data Analytics with Dynamic Global Market Trends on Screen
Dynamic Digital Graph Showing Global Data Movement
Holographic Financial Stock Market Analysis Visualization
Financial Data Analysis Vibrant Graphs on Blue Background
Premium
Analyst Works on Personal Computer Showing business analytics dashboard with charts, metrics and KPI to analyze performance and create insight reports for operations management. Data analysis concept.
Digital Financial Data Analysis on Grid Framework
Dynamic Stock Market Chart with Fluctuating Trends and Data Points
Digital DNA and Brain Data Interface Display in Dark Theme
Financial Analytics Dashboard with Dynamic Charts and Script Display
Premium
Data science analytics and big data technology concept
Futuristic financial dashboard displaying layered stock charts, red and blue trend lines