- Home >
- Stock Photos >
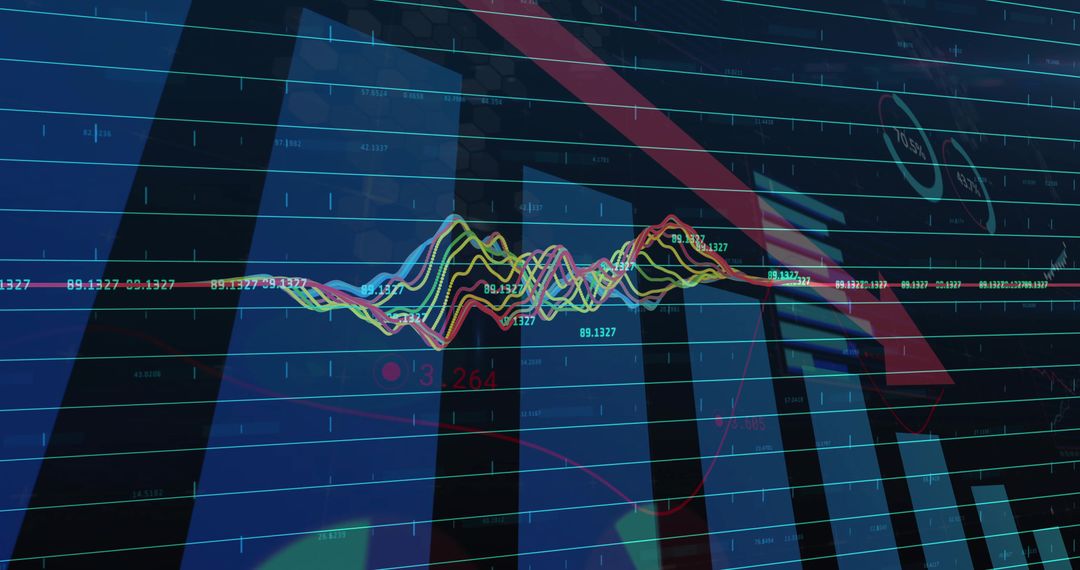
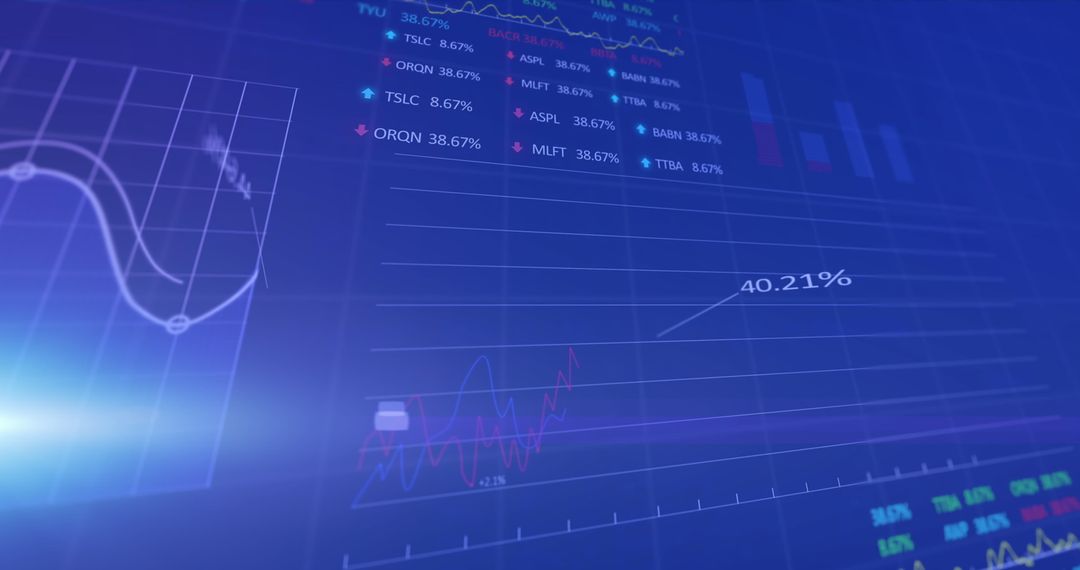
- Digital Financial Data Display with Dynamic Market Charts
Digital Financial Data Display with Dynamic Market Charts Image

Modern depiction of stock market information with numbers and graphs on digital screens showing real-time financial statistics. Suitable for illustrating financial news, investment analysis, and economic trends. Can be used in presentations or articles discussing market movements, economic developments, or investment opportunities.
Powered by 


2
downloads
downloads
Tags:
More
Credit Photo
If you would like to credit the Photo, here are some ways you can do so
Text Link
photo Link
<span class="text-link">
<span>
<a target="_blank" href=https://pikwizard.com/photo/digital-financial-data-display-with-dynamic-market-charts/cf2700cc87c9d0b1818fcd7901e07ebf/>PikWizard</a>
</span>
</span>
<span class="image-link">
<span
style="margin: 0 0 20px 0; display: inline-block; vertical-align: middle; width: 100%;"
>
<a
target="_blank"
href="https://pikwizard.com/photo/digital-financial-data-display-with-dynamic-market-charts/cf2700cc87c9d0b1818fcd7901e07ebf/"
style="text-decoration: none; font-size: 10px; margin: 0;"
>
<img src="https://pikwizard.com/pw/medium/cf2700cc87c9d0b1818fcd7901e07ebf.jpg" style="margin: 0; width: 100%;" alt="" />
<p style="font-size: 12px; margin: 0;">PikWizard</p>
</a>
</span>
</span>
Free (free of charge)
Free for personal and commercial use.
Author: Creative Art
Similar Free Stock Images

Premium


Premium


Premium


Premium


Premium


Premium


Premium


Premium


Premium


Premium


Premium


Premium


Premium


Premium


Premium


Premium


Premium


Premium


Premium


Premium


Premium


Premium


Premium


Premium