- Home >
- Stock Photos >
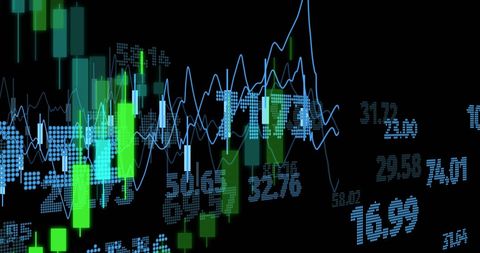
- Digital Financial Data Display with Graphs and Metrics
Digital Financial Data Display with Graphs and Metrics Image

Financial data is represented visually in digital format featuring green grid-like graphs and numerical indicators against a dark background. The sophisticated design highlights metrics pertinent to stocks or investment interests. Perfect for use in financial platforms, educational content for data analysis training, and marketing material promoting financial and technological solutions.
Powered by 


downloads
Tags:
More
Credit Photo
If you would like to credit the Photo, here are some ways you can do so
Text Link
photo Link
<span class="text-link">
<span>
<a target="_blank" href=https://pikwizard.com/photo/digital-financial-data-display-with-graphs-and-metrics/bee6ff9e1362c5a2b231b21d852dc0c0/>PikWizard</a>
</span>
</span>
<span class="image-link">
<span
style="margin: 0 0 20px 0; display: inline-block; vertical-align: middle; width: 100%;"
>
<a
target="_blank"
href="https://pikwizard.com/photo/digital-financial-data-display-with-graphs-and-metrics/bee6ff9e1362c5a2b231b21d852dc0c0/"
style="text-decoration: none; font-size: 10px; margin: 0;"
>
<img src="https://pikwizard.com/pw/medium/bee6ff9e1362c5a2b231b21d852dc0c0.jpg" style="margin: 0; width: 100%;" alt="" />
<p style="font-size: 12px; margin: 0;">PikWizard</p>
</a>
</span>
</span>
Free (free of charge)
Free for personal and commercial use.
Author: People Creations
Similar Free Stock Images
Loading...

Premium


Premium


Premium

Premium


Premium


Premium


Premium


Premium

Premium

Premium


Premium


Premium


Premium

Premium


Premium

Premium


Premium


Premium


Premium

Premium


Premium


Premium


Premium


Premium

Premium