- Home >
- Stock Photos >
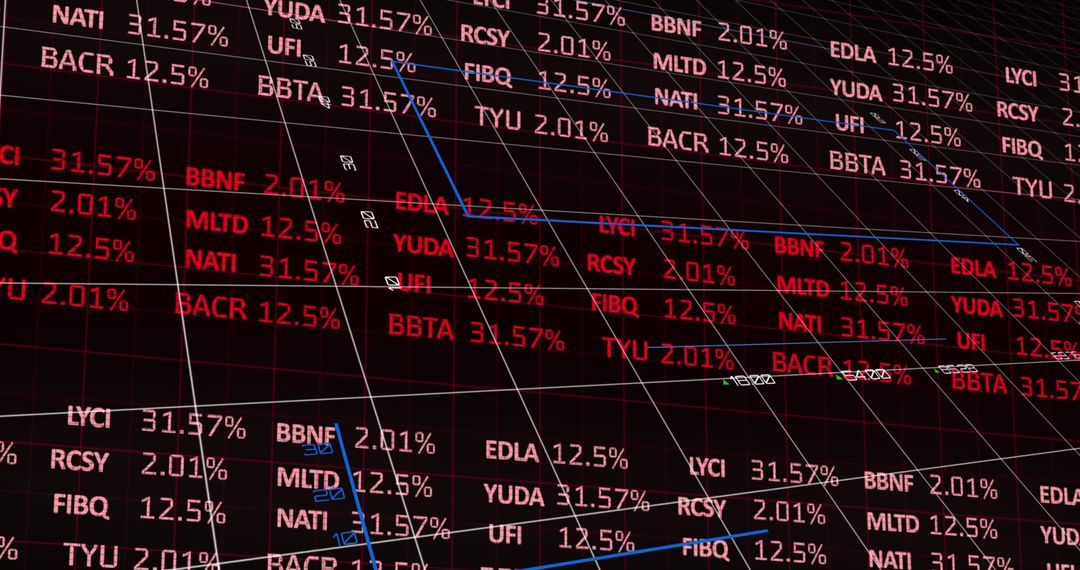
- Digital Financial Data Display with Red and Blue Highlights
Digital Financial Data Display with Red and Blue Highlights Image

This representation of digital financial data features red numerical information with blue spot highlights on a black background, creating a modern and dynamic aesthetic. Ideal for use as a visual backdrop in presentations about global finance, stock trading, investment strategies, or market analysis. The futuristic and technological feel complements innovative business solutions and finance-themed digital media.
Powered by  - Get 15% off with code: PIKWIZARD15


2
downloads
downloads
Tags:
More
Credit Photo
If you would like to credit the Photo, here are some ways you can do so
Text Link
photo Link
<span class="text-link">
<span>
<a target="_blank" href=https://pikwizard.com/photo/digital-financial-data-display-with-red-and-blue-highlights/b9655f41a6946cd2b3c08066a5e36228/>PikWizard</a>
</span>
</span>
<span class="image-link">
<span
style="margin: 0 0 20px 0; display: inline-block; vertical-align: middle; width: 100%;"
>
<a
target="_blank"
href="https://pikwizard.com/photo/digital-financial-data-display-with-red-and-blue-highlights/b9655f41a6946cd2b3c08066a5e36228/"
style="text-decoration: none; font-size: 10px; margin: 0;"
>
<img src="https://pikwizard.com/pw/medium/b9655f41a6946cd2b3c08066a5e36228.jpg" style="margin: 0; width: 100%;" alt="" />
<p style="font-size: 12px; margin: 0;">PikWizard</p>
</a>
</span>
</span>
Free (free of charge)
Free for personal and commercial use.
Author: People Creations
Similar Free Stock Images

Premium


Premium


Premium


Premium


Premium


Premium


Premium


Premium


Premium


Premium


Premium


Premium


Premium


Premium


Premium


Premium


Premium


Premium


Premium


Premium


Premium


Premium


Premium


Premium