- Home >
- Stock Photos >
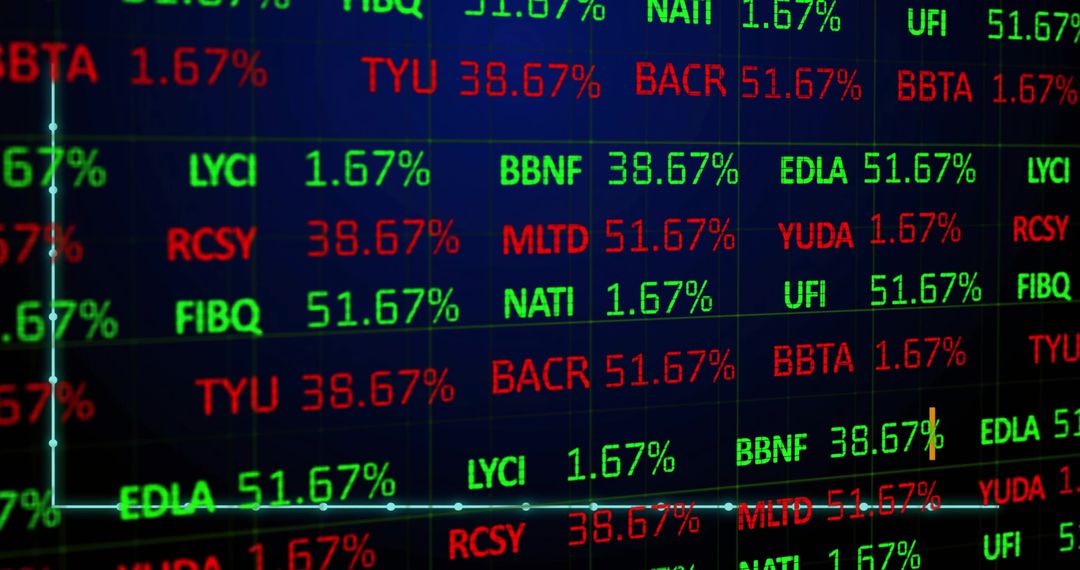
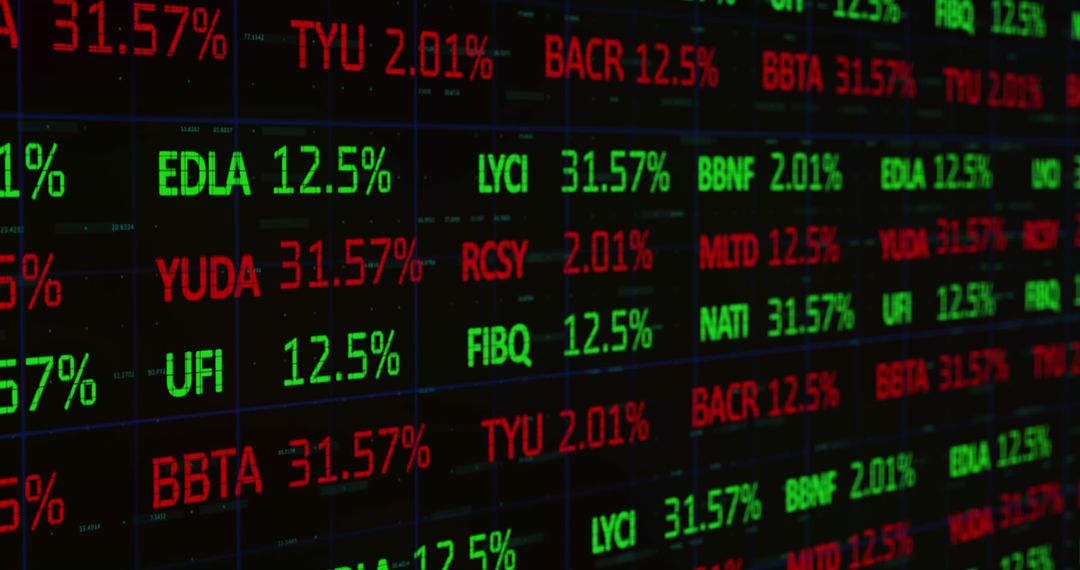
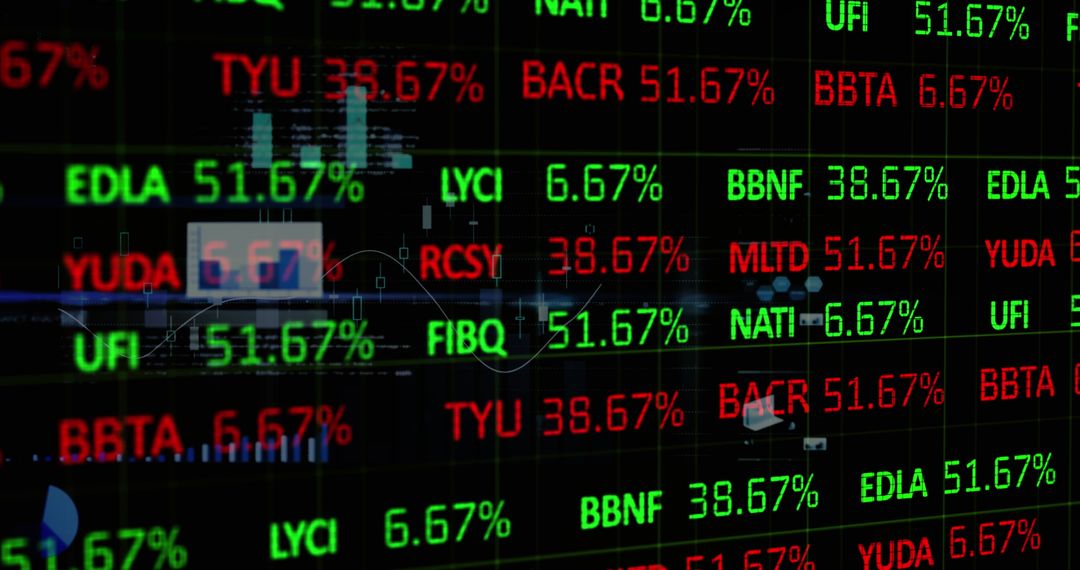
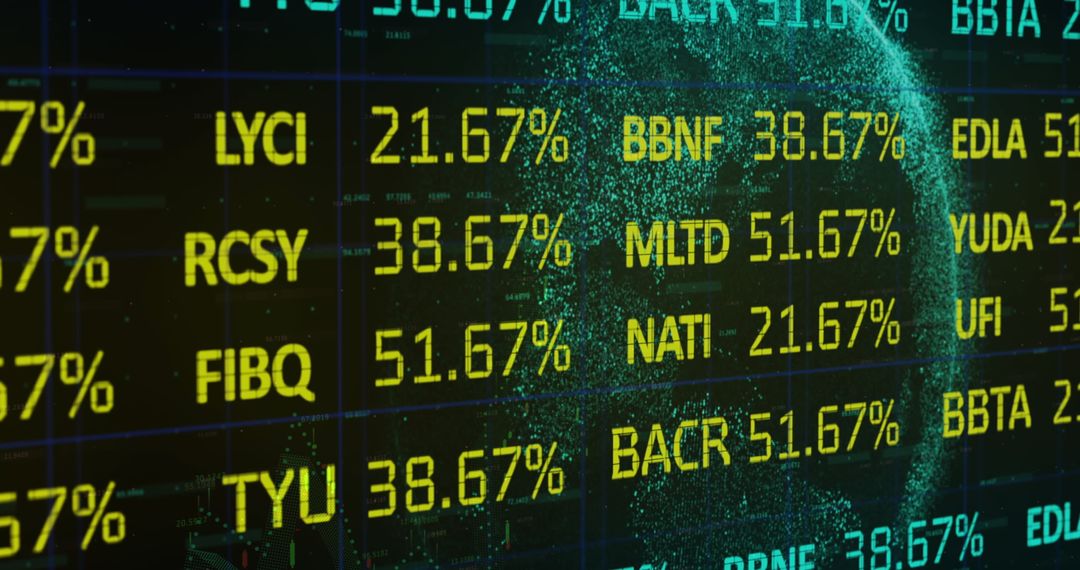
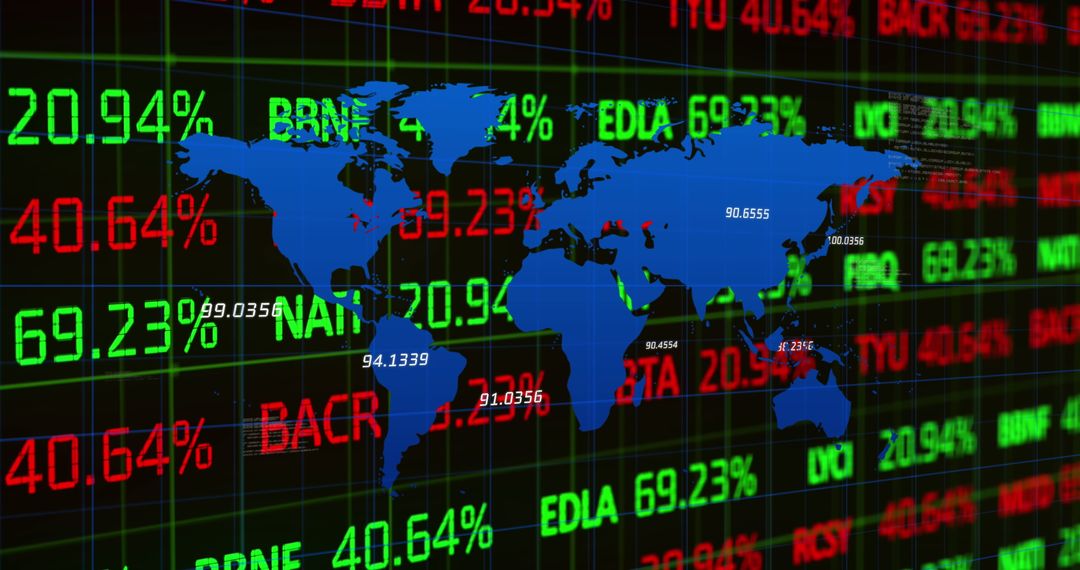
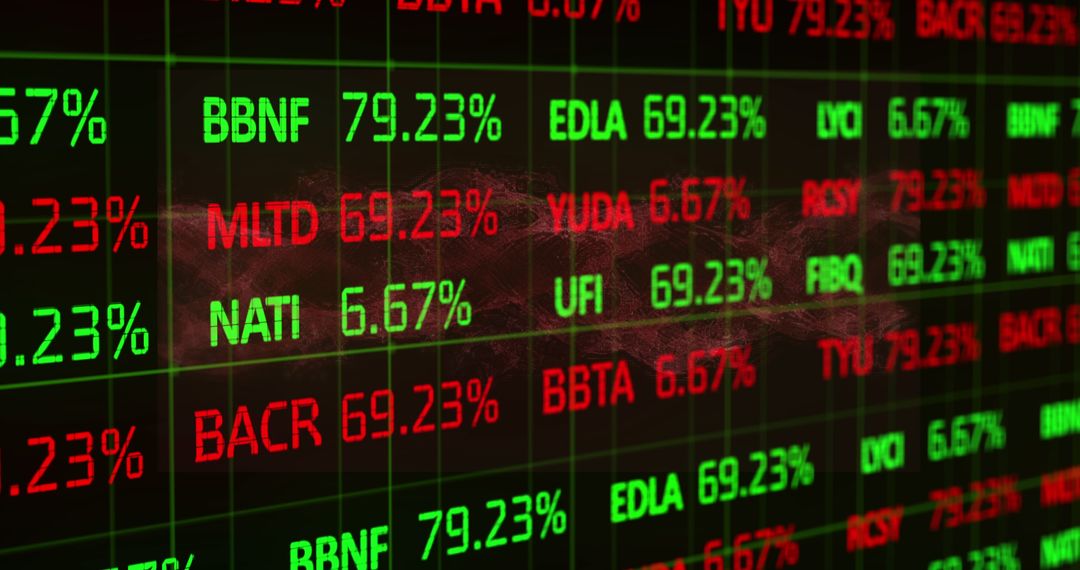
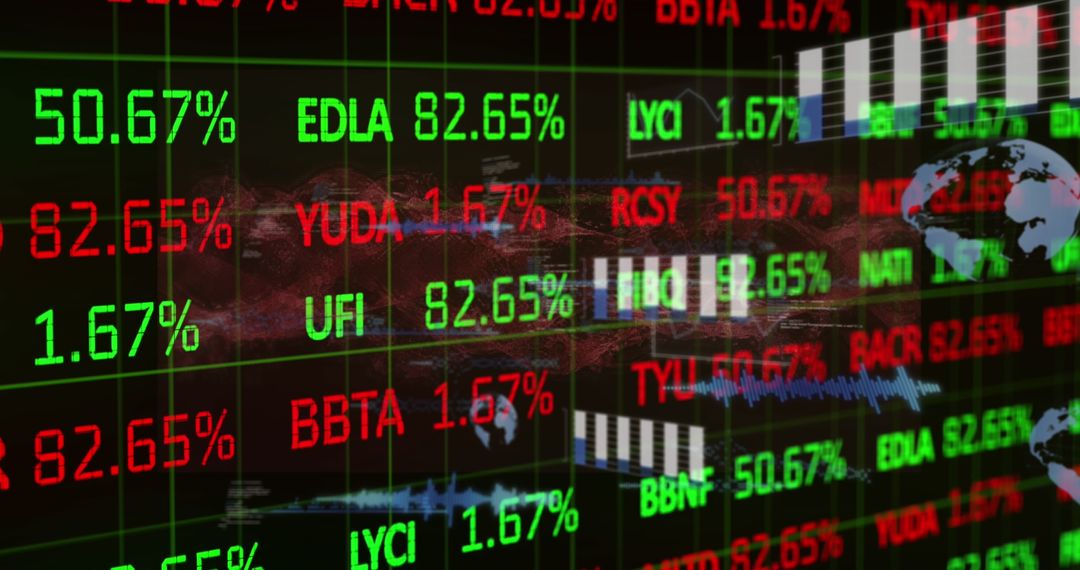
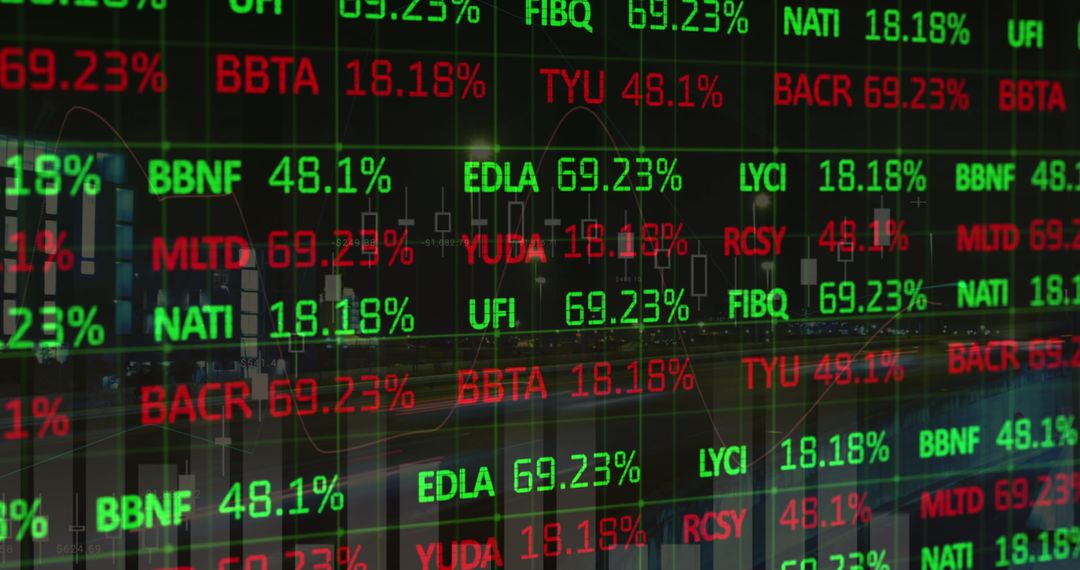
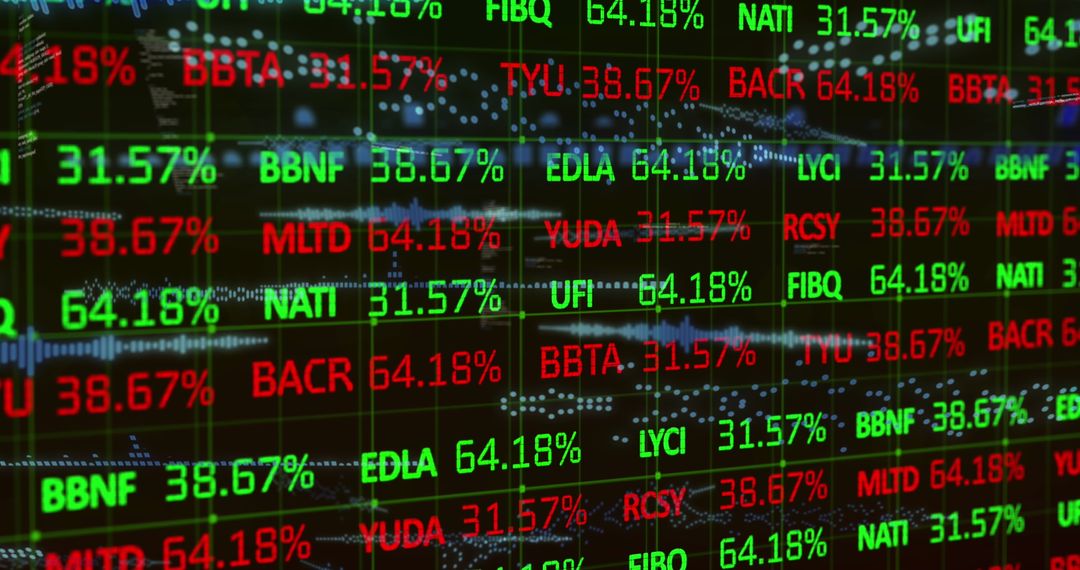
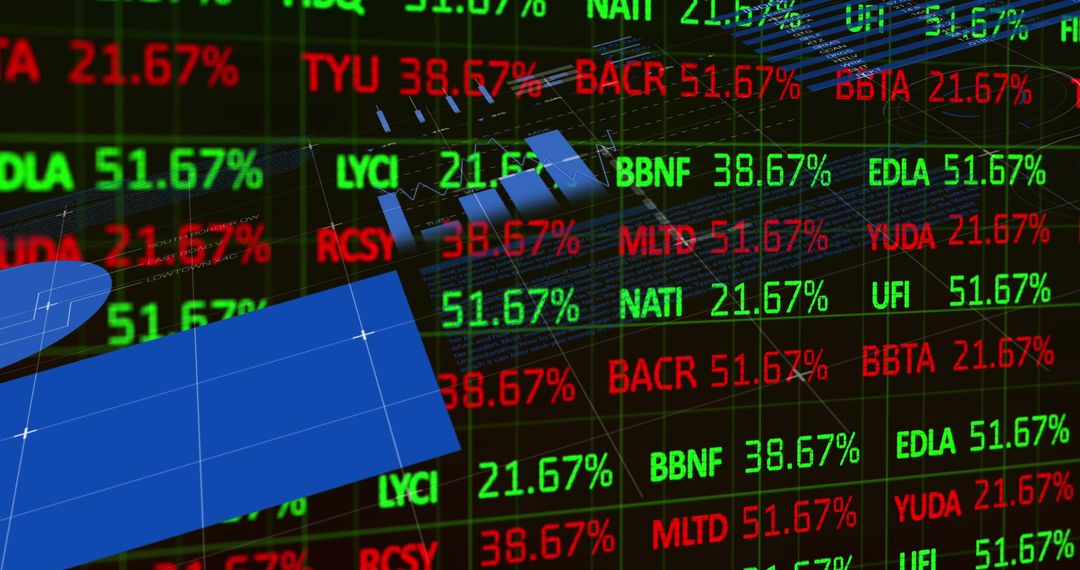
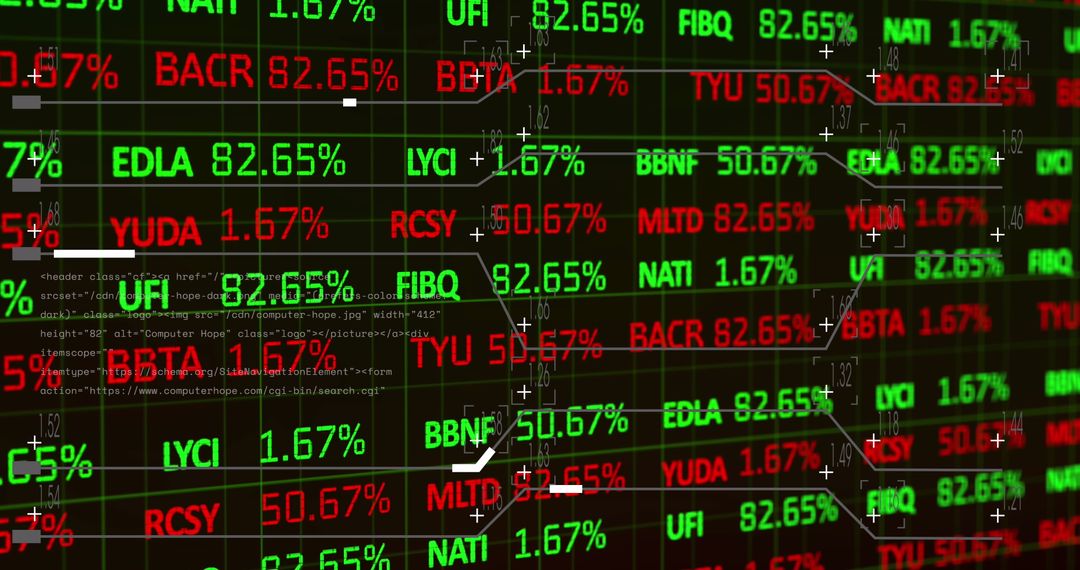
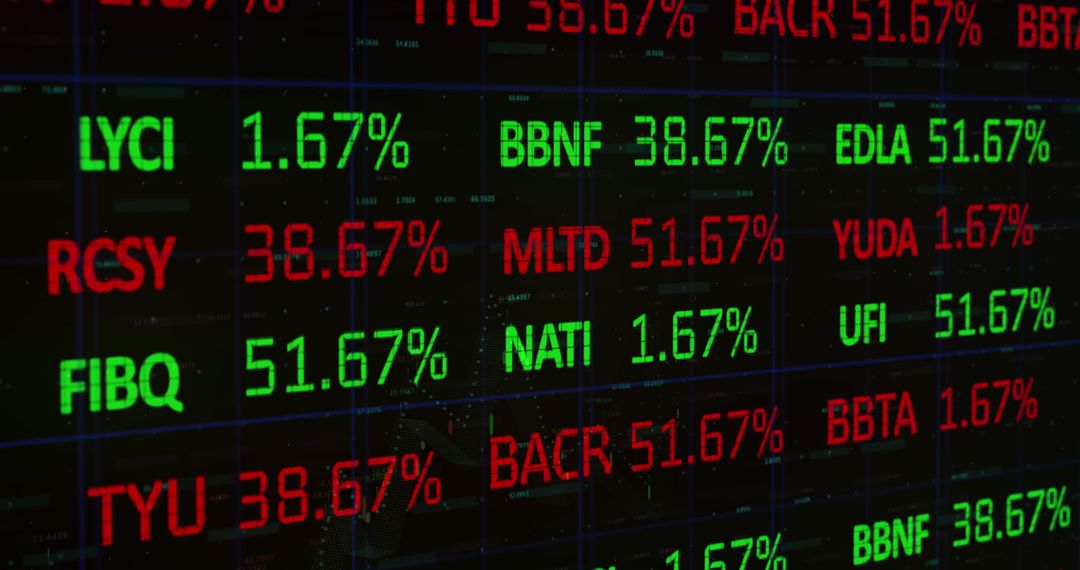
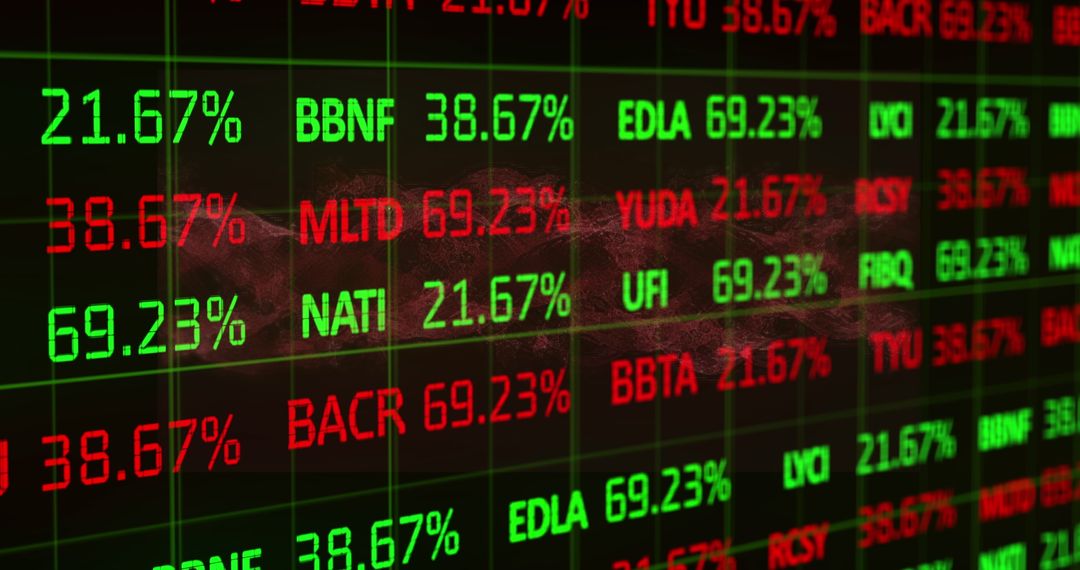
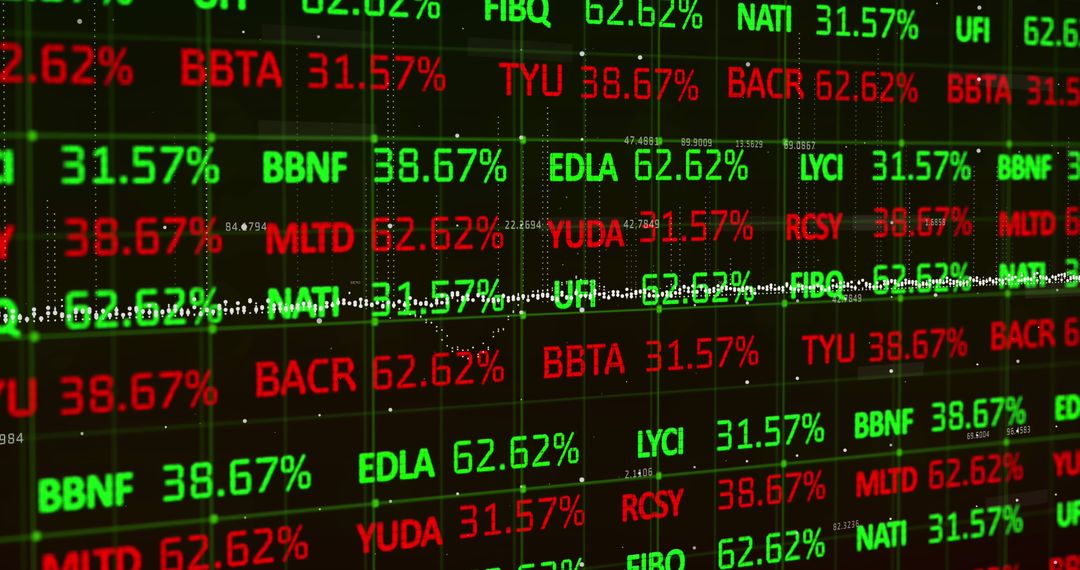
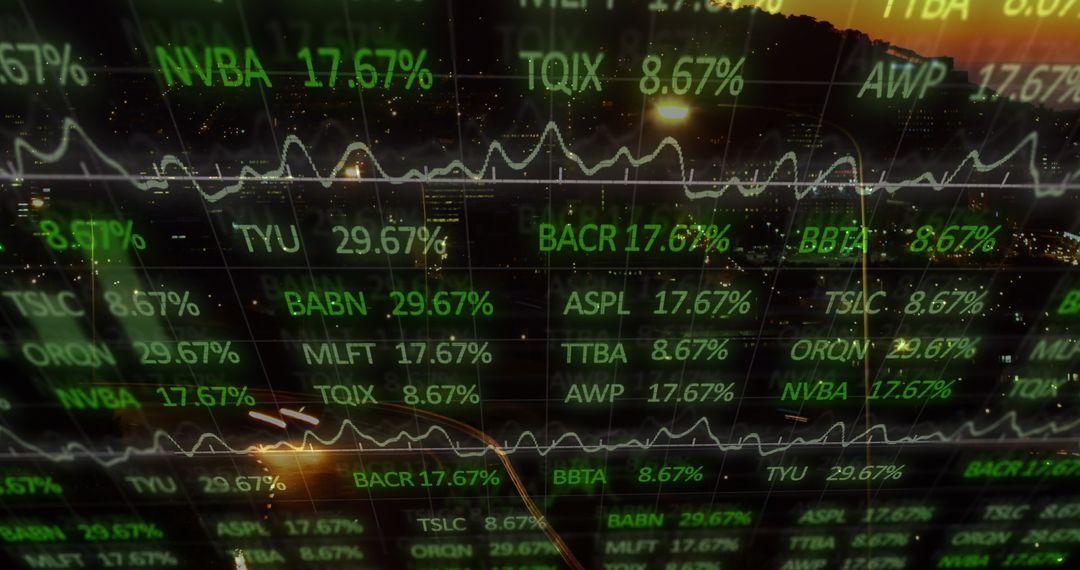
- Digital Financial Data Display with Stock Market Indicators
Digital Financial Data Display with Stock Market Indicators Image

Bright red and green numbers and letters display on a digital screen showing financial data and stock market indicators. Represents global finance and the fast-paced world of trading and technology. Useful for presentations and articles on investment, economy trends, or technological stock analyses.
Powered by 


2
downloads
downloads
Tags:
More
Credit Photo
If you would like to credit the Photo, here are some ways you can do so
Text Link
photo Link
<span class="text-link">
<span>
<a target="_blank" href=https://pikwizard.com/photo/digital-financial-data-display-with-stock-market-indicators/80b7f868a25eaf4f04659c63207a1d82/>PikWizard</a>
</span>
</span>
<span class="image-link">
<span
style="margin: 0 0 20px 0; display: inline-block; vertical-align: middle; width: 100%;"
>
<a
target="_blank"
href="https://pikwizard.com/photo/digital-financial-data-display-with-stock-market-indicators/80b7f868a25eaf4f04659c63207a1d82/"
style="text-decoration: none; font-size: 10px; margin: 0;"
>
<img src="https://pikwizard.com/pw/medium/80b7f868a25eaf4f04659c63207a1d82.jpg" style="margin: 0; width: 100%;" alt="" />
<p style="font-size: 12px; margin: 0;">PikWizard</p>
</a>
</span>
</span>
Free (free of charge)
Free for personal and commercial use.
Author: Creative Art
Similar Free Stock Images
Premium


Premium


Premium

Premium


Premium


Premium


Premium


Premium


Premium


Premium


Premium


Premium


Premium


Premium


Premium

Premium


Premium


Premium


Premium


Premium


Premium


Premium


Premium


Premium