
- Home >
- Stock Photos >
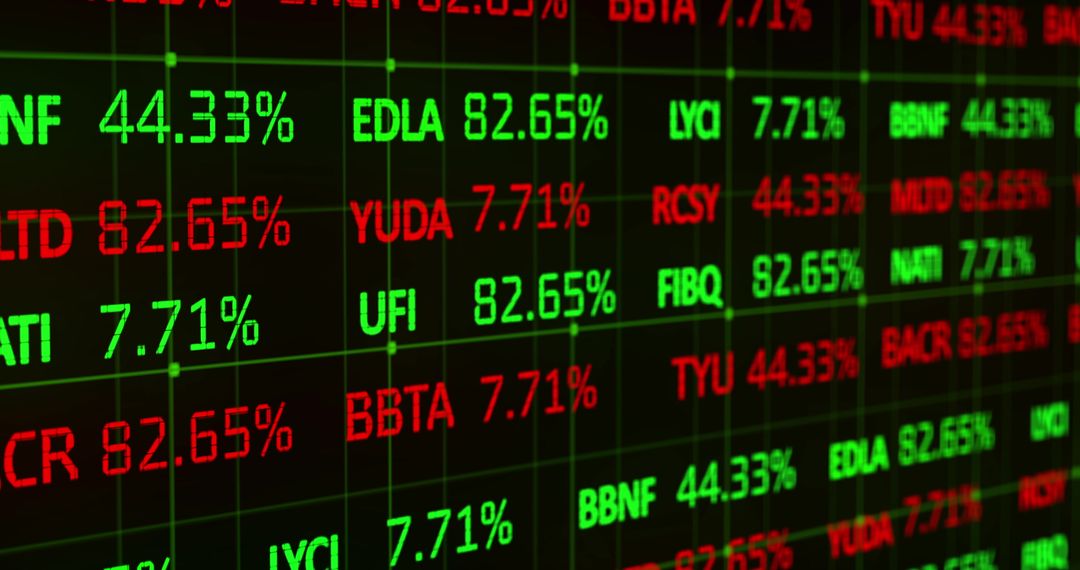
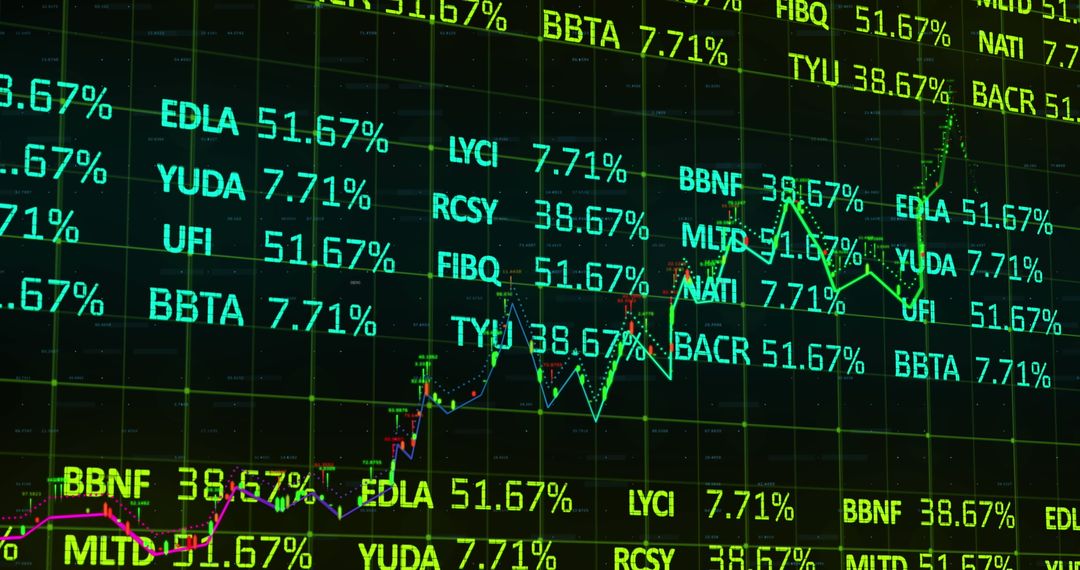
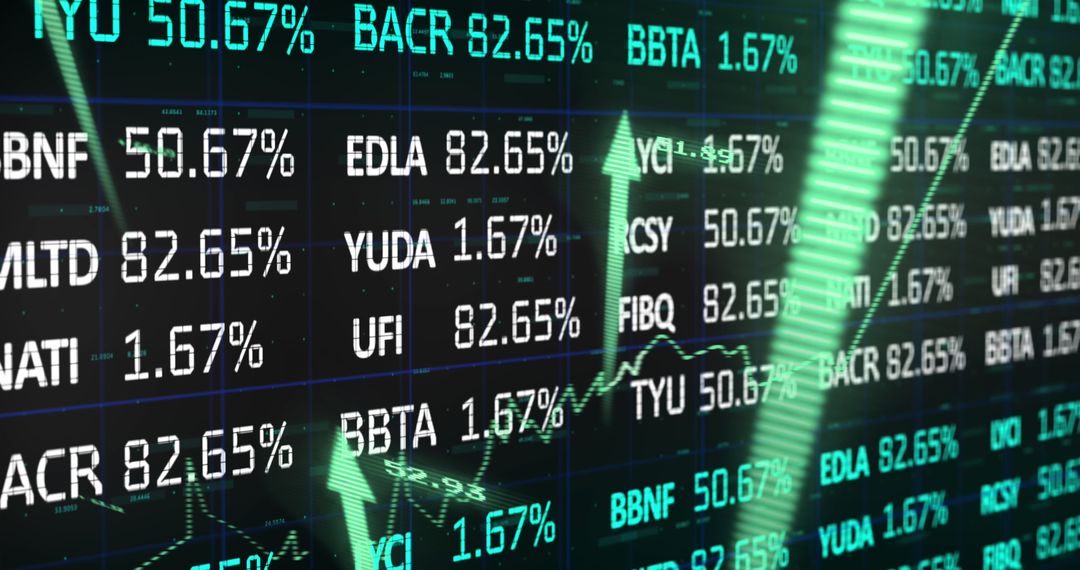
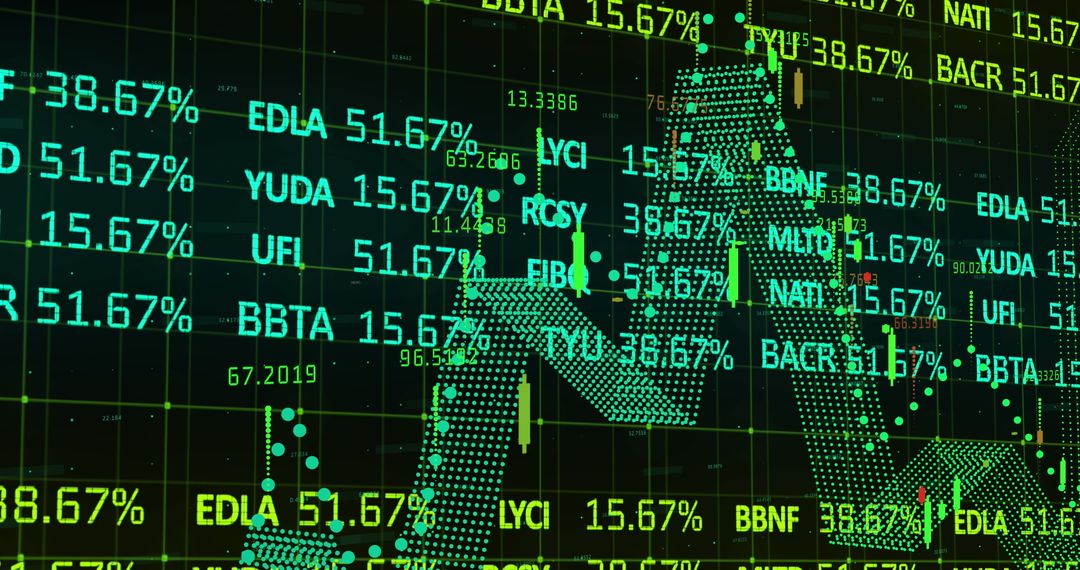
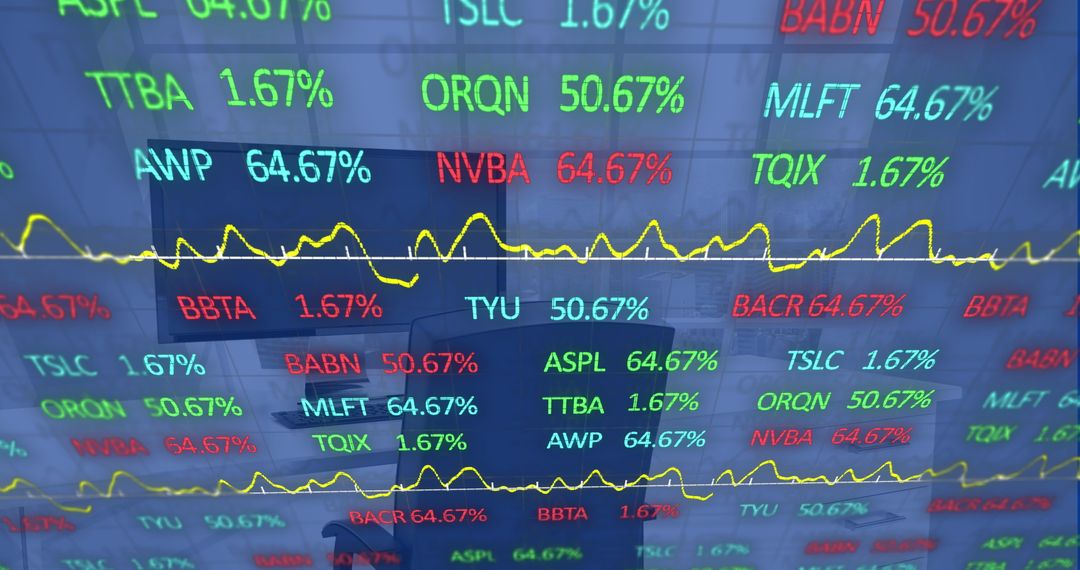
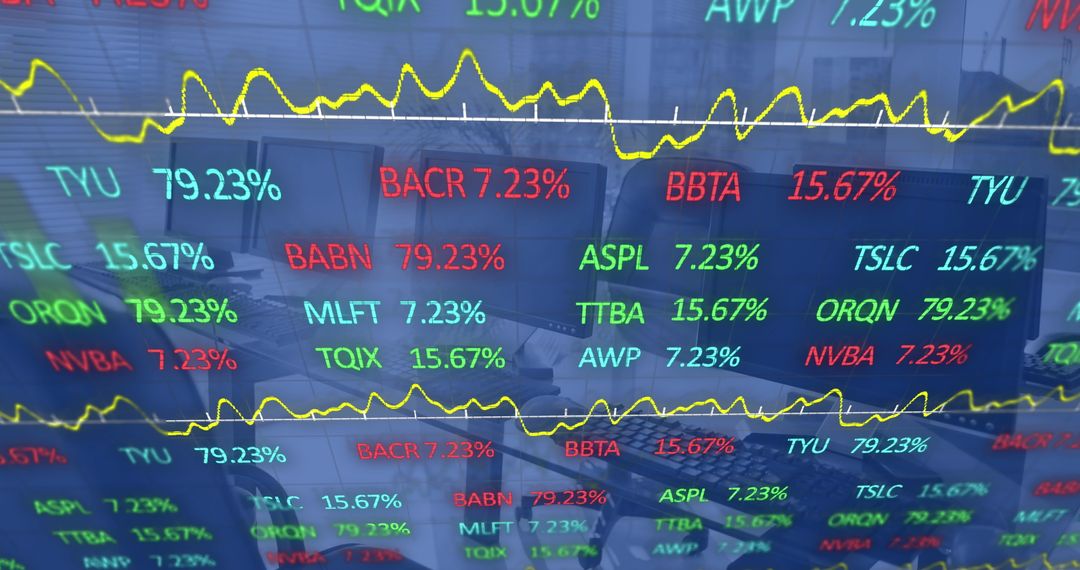
- Digital Financial Data Display with Stock Trends and Graph
Digital Financial Data Display with Stock Trends and Graph Image

Vibrant financial data on digital display showing fluctuating stock trends and graphs. This setting illustrates the dynamic nature of the stock market, ideal for articles on market analysis, investment strategies, or trading tools. Useful for financial reports, presentations, and marketing materials in finance sectors.
Powered by  - Get 15% off with code: PIKWIZARD15


2
downloads
downloads
Tags:
More
Credit Photo
If you would like to credit the Photo, here are some ways you can do so
Text Link
photo Link
<span class="text-link">
<span>
<a target="_blank" href=https://pikwizard.com/photo/digital-financial-data-display-with-stock-trends-and-graph/719cae634f07427baaba5e9c883b87ed/>PikWizard</a>
</span>
</span>
<span class="image-link">
<span
style="margin: 0 0 20px 0; display: inline-block; vertical-align: middle; width: 100%;"
>
<a
target="_blank"
href="https://pikwizard.com/photo/digital-financial-data-display-with-stock-trends-and-graph/719cae634f07427baaba5e9c883b87ed/"
style="text-decoration: none; font-size: 10px; margin: 0;"
>
<img src="https://pikwizard.com/pw/medium/719cae634f07427baaba5e9c883b87ed.jpg" style="margin: 0; width: 100%;" alt="" />
<p style="font-size: 12px; margin: 0;">PikWizard</p>
</a>
</span>
</span>
Free (free of charge)
Free for personal and commercial use.
Author: Authentic Images
Similar Free Stock Images
Premium


Premium


Premium


Premium


Premium


Premium


Premium


Premium


Premium


Premium


Premium


Premium


Premium


Premium


Premium


Premium


Premium


Premium


Premium


Premium


Premium


Premium


Premium


Premium

