
- Home >
- Stock Photos >
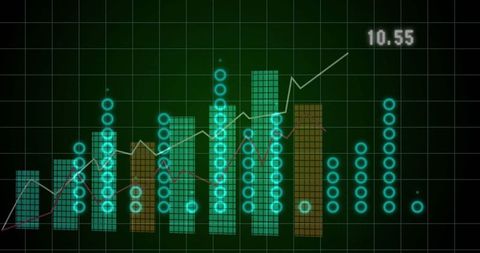
- Digital Financial Data Graph on Green Grid Background
Digital Financial Data Graph on Green Grid Background Image

This image showcases a digital graph representing financial data over a green grid background, with vertical bars and numerics. Ideal for use in financial presentations, economic reports, or technology-related articles. The grid and data analytics theme suit educational materials and infographic designs.
Powered by 


downloads
Tags:
More
Credit Photo
If you would like to credit the Photo, here are some ways you can do so
Text Link
photo Link
<span class="text-link">
<span>
<a target="_blank" href=https://pikwizard.com/photo/digital-financial-data-graph-on-green-grid-background/32fa08a86265081e2a95d2cf699f851d/>PikWizard</a>
</span>
</span>
<span class="image-link">
<span
style="margin: 0 0 20px 0; display: inline-block; vertical-align: middle; width: 100%;"
>
<a
target="_blank"
href="https://pikwizard.com/photo/digital-financial-data-graph-on-green-grid-background/32fa08a86265081e2a95d2cf699f851d/"
style="text-decoration: none; font-size: 10px; margin: 0;"
>
<img src="https://pikwizard.com/pw/medium/32fa08a86265081e2a95d2cf699f851d.jpg" style="margin: 0; width: 100%;" alt="" />
<p style="font-size: 12px; margin: 0;">PikWizard</p>
</a>
</span>
</span>
Free (free of charge)
Free for personal and commercial use.
Author: Authentic Images
Similar Free Stock Images

Premium


Premium

Premium


Premium


Premium


Premium

Premium


Premium


Premium


Premium

Premium


Premium


Premium

Premium


Premium


Premium


Premium


Premium


Premium


Premium


Premium


Premium


Premium


Premium


Premium


Explore More Free Stock Images