
- Home >
- Stock Photos >
- Digital Financial Data Graph with Statistics and Figures
Digital Financial Data Graph with Statistics and Figures Image

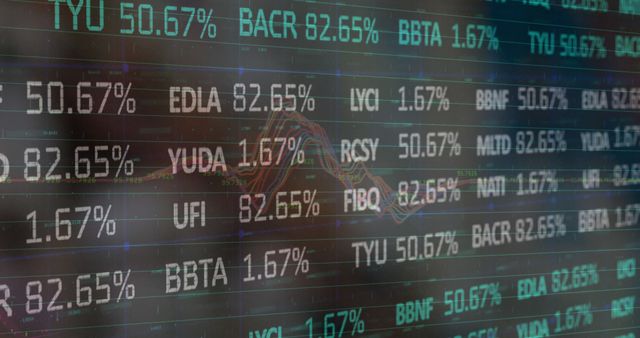
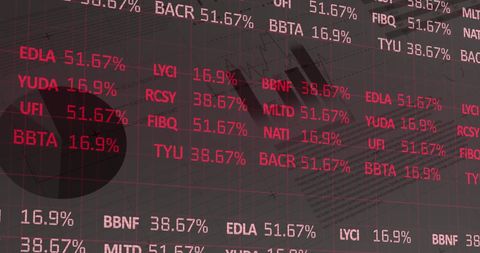
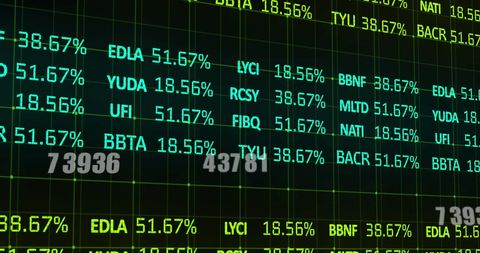
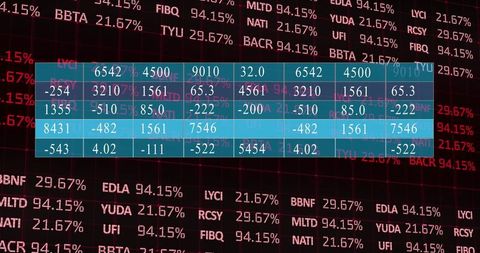
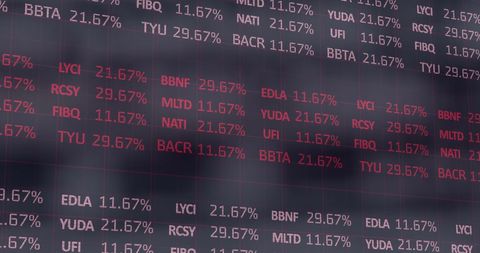
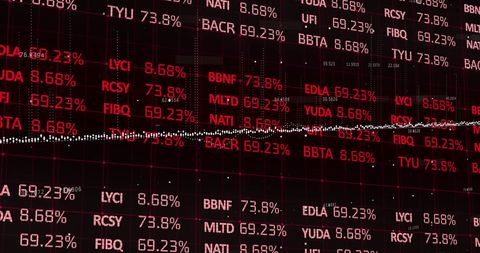
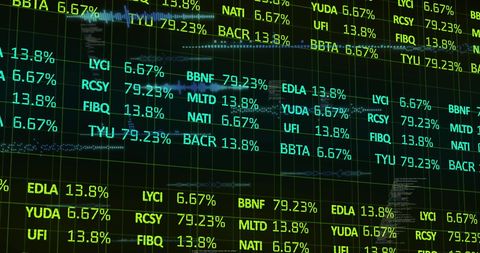
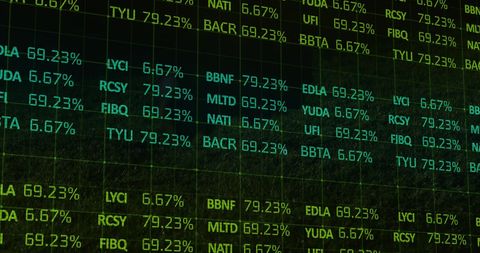
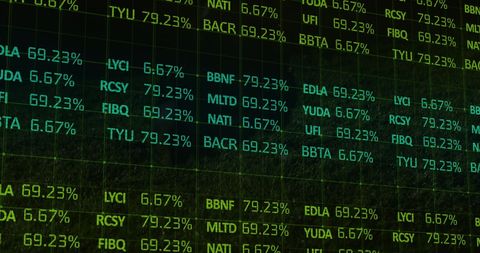
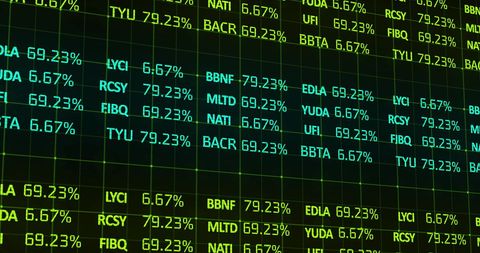
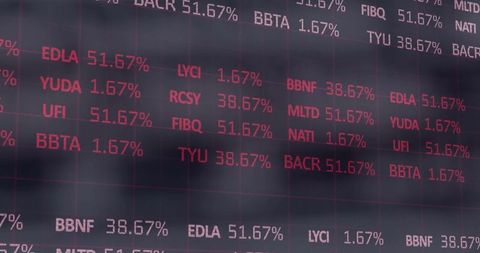
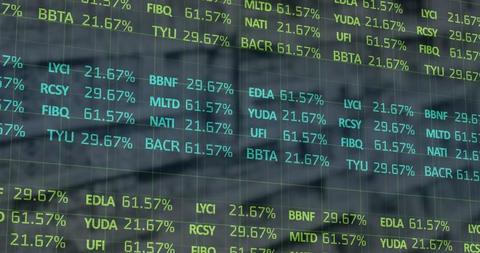
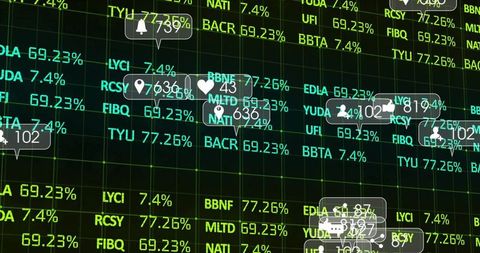
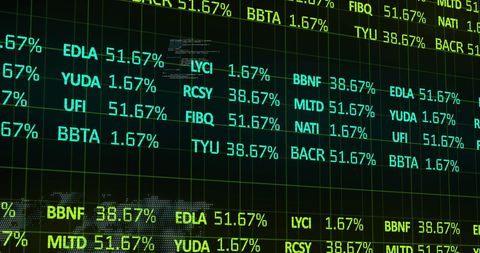
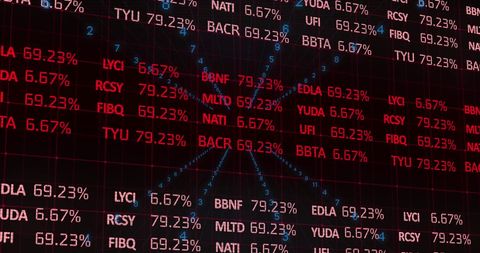
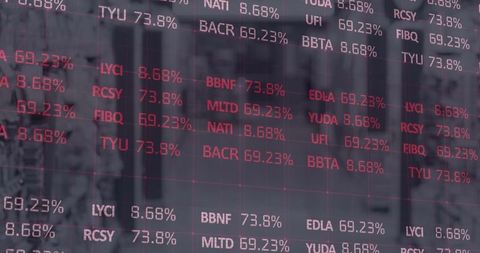
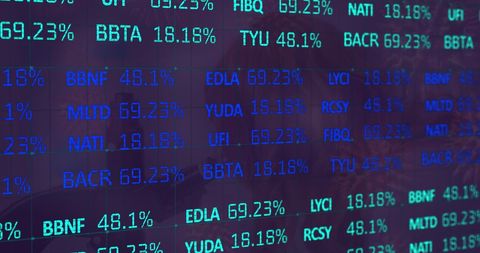
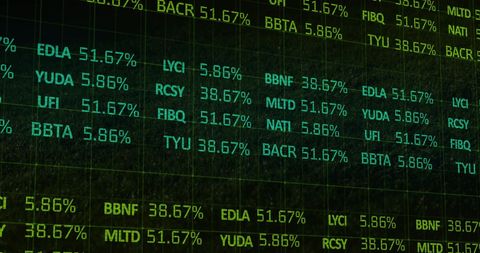
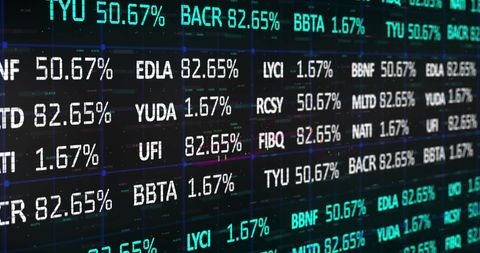
Dynamic visual demonstrating various financial data and statistics in digital format. Consists of red and white numeric and textual values, representing potentially fluctuating investment activity. Useful as a background or illustration for articles on global finance, stock markets, or digital economic forecasts. Ideal for presentations related to financial technology, data analysis, or business development.
Powered by 


downloads
Tags:
More
Credit Photo
If you would like to credit the Photo, here are some ways you can do so
Text Link
photo Link
<span class="text-link">
<span>
<a target="_blank" href=https://pikwizard.com/photo/digital-financial-data-graph-with-statistics-and-figures/f54d3390617086c8a21d65bb4f0ebb30/>PikWizard</a>
</span>
</span>
<span class="image-link">
<span
style="margin: 0 0 20px 0; display: inline-block; vertical-align: middle; width: 100%;"
>
<a
target="_blank"
href="https://pikwizard.com/photo/digital-financial-data-graph-with-statistics-and-figures/f54d3390617086c8a21d65bb4f0ebb30/"
style="text-decoration: none; font-size: 10px; margin: 0;"
>
<img src="https://pikwizard.com/pw/medium/f54d3390617086c8a21d65bb4f0ebb30.jpg" style="margin: 0; width: 100%;" alt="" />
<p style="font-size: 12px; margin: 0;">PikWizard</p>
</a>
</span>
</span>
Free (free of charge)
Free for personal and commercial use.
Author: Awesome Content
Similar Free Stock Images

Premium


Premium


Premium


Premium


Premium


Premium

Premium


Premium


Premium

Premium


Premium

Premium


Premium

Premium

Premium


Premium


Premium


Premium


Premium


Premium

Premium


Premium

Premium


Premium


Premium

Explore More Free Stock Images