
- Home >
- Stock Photos >
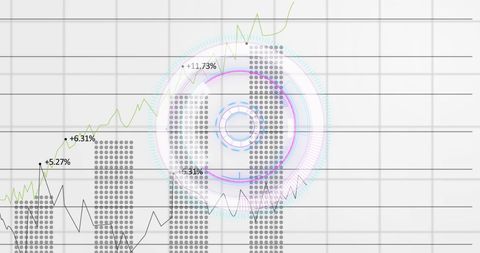
- Digital Financial Data Grid with Numerical Analysis Elements
Digital Financial Data Grid with Numerical Analysis Elements Image

Interesting depiction of a financial grid showcasing numerical data and colored markers symbolizing different indicators on a clean digital interface. It can be effectively used for projects related to finance, technology, economics, or global market analysis themes, presenting complex data visualization concepts in digital media presentations and promotional materials.
Powered by 


downloads
Tags:
More
Credit Photo
If you would like to credit the Photo, here are some ways you can do so
Text Link
photo Link
<span class="text-link">
<span>
<a target="_blank" href=https://pikwizard.com/photo/digital-financial-data-grid-with-numerical-analysis-elements/39026263bdd5f4c10222887b54054585/>PikWizard</a>
</span>
</span>
<span class="image-link">
<span
style="margin: 0 0 20px 0; display: inline-block; vertical-align: middle; width: 100%;"
>
<a
target="_blank"
href="https://pikwizard.com/photo/digital-financial-data-grid-with-numerical-analysis-elements/39026263bdd5f4c10222887b54054585/"
style="text-decoration: none; font-size: 10px; margin: 0;"
>
<img src="https://pikwizard.com/pw/medium/39026263bdd5f4c10222887b54054585.jpg" style="margin: 0; width: 100%;" alt="" />
<p style="font-size: 12px; margin: 0;">PikWizard</p>
</a>
</span>
</span>
Free (free of charge)
Free for personal and commercial use.
Author: Creative Art
Similar Free Stock Images

Premium


Premium


Premium


Premium

Premium


Premium


Premium


Premium


Premium


Premium


Premium


Premium

Premium


Premium


Premium


Premium


Premium

Premium


Premium

Premium

Premium

Premium


Premium


Premium


Premium


Explore More Free Stock Images