- Home >
- Stock Photos >
- Digital Financial Data Interface with Charts and Graphs Overlay
Digital Financial Data Interface with Charts and Graphs Overlay Image

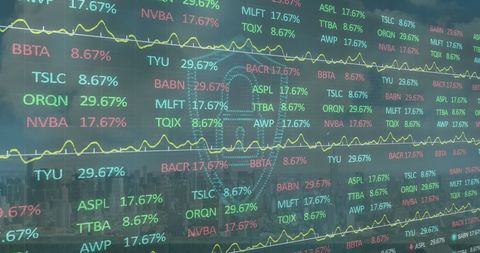
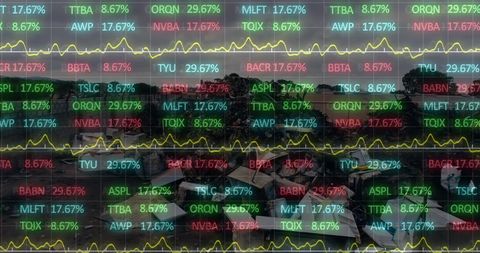
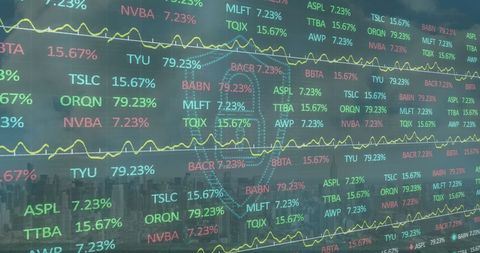
The image shows financial data processing with an overlay of graphs and charts, speaking to global communication and business complexity. Ideal for use in articles or reports related to stock market trends, economic analysis, investment strategies, or fiscal policy updates.

downloads
Tags:
More
Credit Photo
If you would like to credit the Photo, here are some ways you can do so
Text Link
photo Link
<span class="text-link">
<span>
<a target="_blank" href=https://pikwizard.com/photo/digital-financial-data-interface-with-charts-and-graphs-overlay/b8c7be32ee78a5733beb2827ae6ea7ca/>PikWizard</a>
</span>
</span>
<span class="image-link">
<span
style="margin: 0 0 20px 0; display: inline-block; vertical-align: middle; width: 100%;"
>
<a
target="_blank"
href="https://pikwizard.com/photo/digital-financial-data-interface-with-charts-and-graphs-overlay/b8c7be32ee78a5733beb2827ae6ea7ca/"
style="text-decoration: none; font-size: 10px; margin: 0;"
>
<img src="https://pikwizard.com/pw/medium/b8c7be32ee78a5733beb2827ae6ea7ca.jpg" style="margin: 0; width: 100%;" alt="" />
<p style="font-size: 12px; margin: 0;">PikWizard</p>
</a>
</span>
</span>
Free (free of charge)
Free for personal and commercial use.
Author: Authentic Images