- Home >
- Stock Photos >
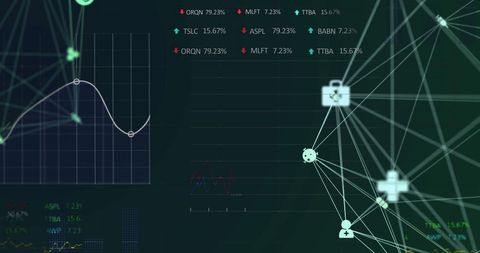
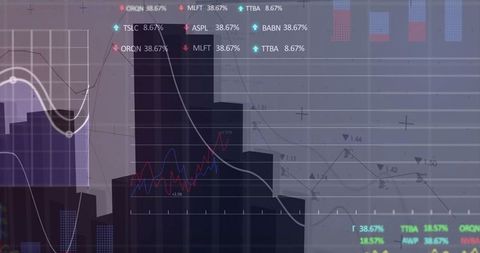
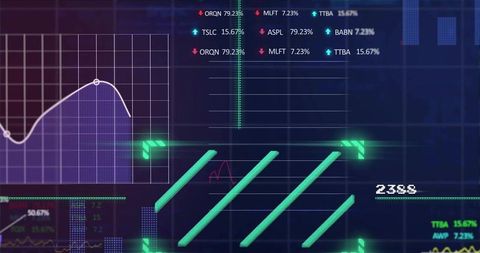
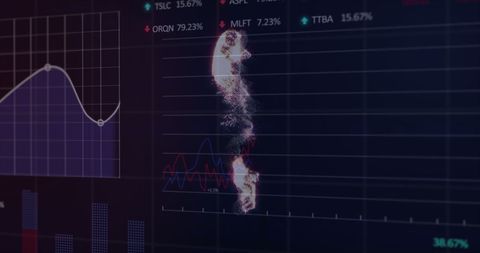
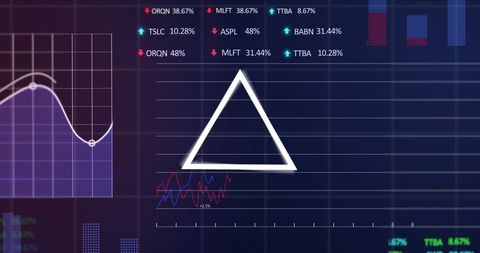
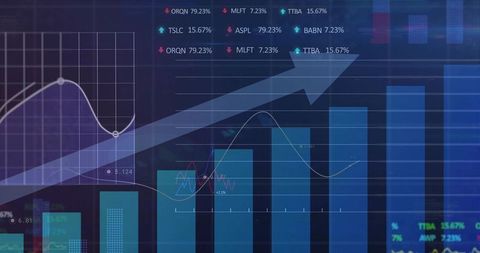
- Digital Financial Data Interface with Graphs and Trends
Digital Financial Data Interface with Graphs and Trends Image

This complex visual representation showcases a digital interface filled with financial data, graphs, and trending indicators on a black background. Ideal for illustrating concepts related to finance, stock market analysis, data science, and corporate scenarios, this image emphasizes the intersection of technology and worldwide financial processing. Suitable for use in presentations, websites focused on finance news or software solutions tailored for data analytics identifying market trends over the years.

downloads
Tags:
More
Credit Photo
If you would like to credit the Photo, here are some ways you can do so
Text Link
photo Link
<span class="text-link">
<span>
<a target="_blank" href=https://pikwizard.com/photo/digital-financial-data-interface-with-graphs-and-trends/84464585823fbea3ab5fc82c7840b62f/>PikWizard</a>
</span>
</span>
<span class="image-link">
<span
style="margin: 0 0 20px 0; display: inline-block; vertical-align: middle; width: 100%;"
>
<a
target="_blank"
href="https://pikwizard.com/photo/digital-financial-data-interface-with-graphs-and-trends/84464585823fbea3ab5fc82c7840b62f/"
style="text-decoration: none; font-size: 10px; margin: 0;"
>
<img src="https://pikwizard.com/pw/medium/84464585823fbea3ab5fc82c7840b62f.jpg" style="margin: 0; width: 100%;" alt="" />
<p style="font-size: 12px; margin: 0;">PikWizard</p>
</a>
</span>
</span>
Free (free of charge)
Free for personal and commercial use.
Author: Awesome Content