
- Home >
- Stock Photos >
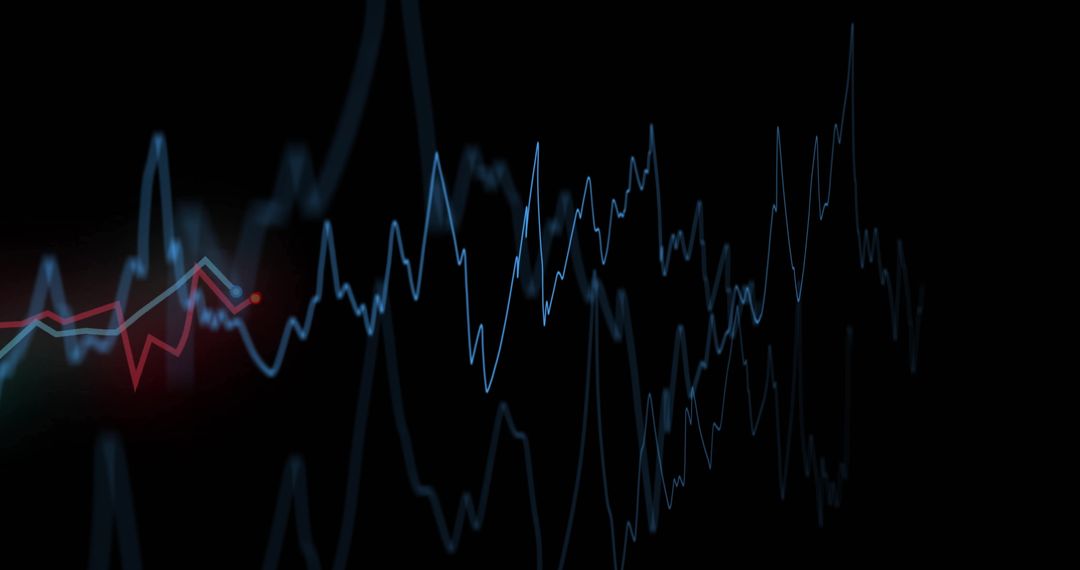
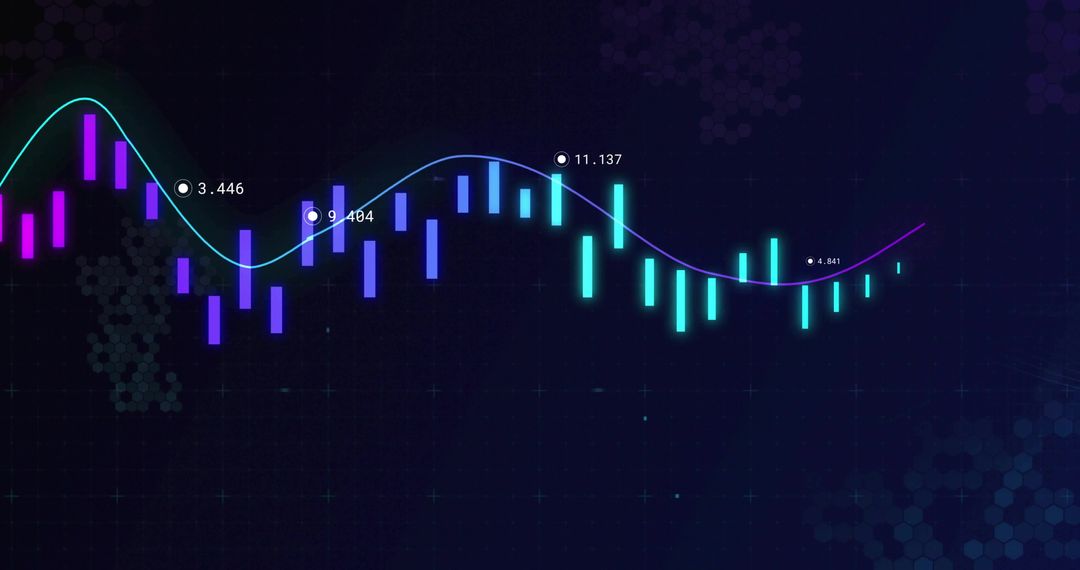
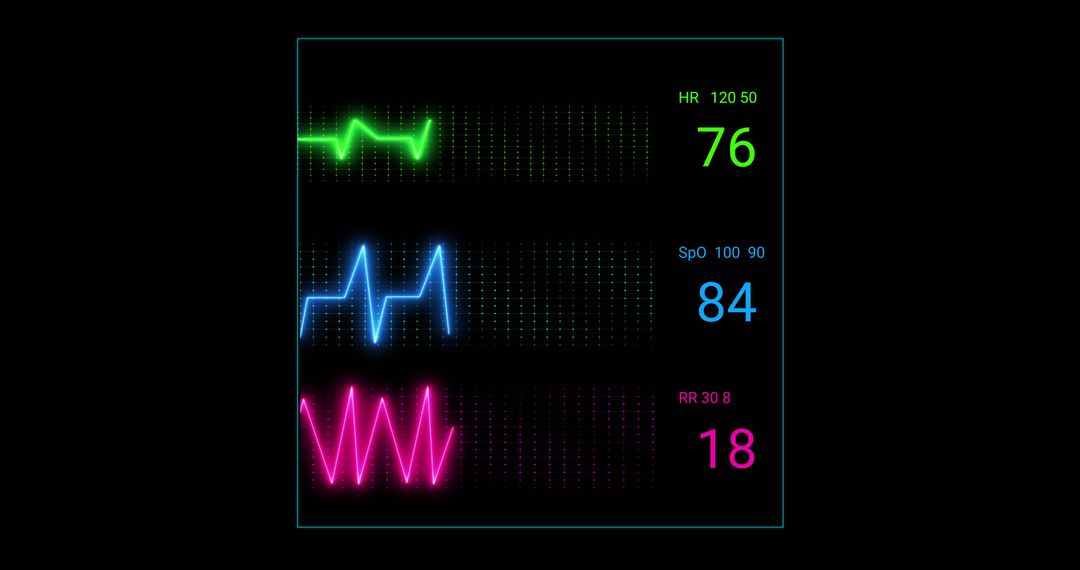
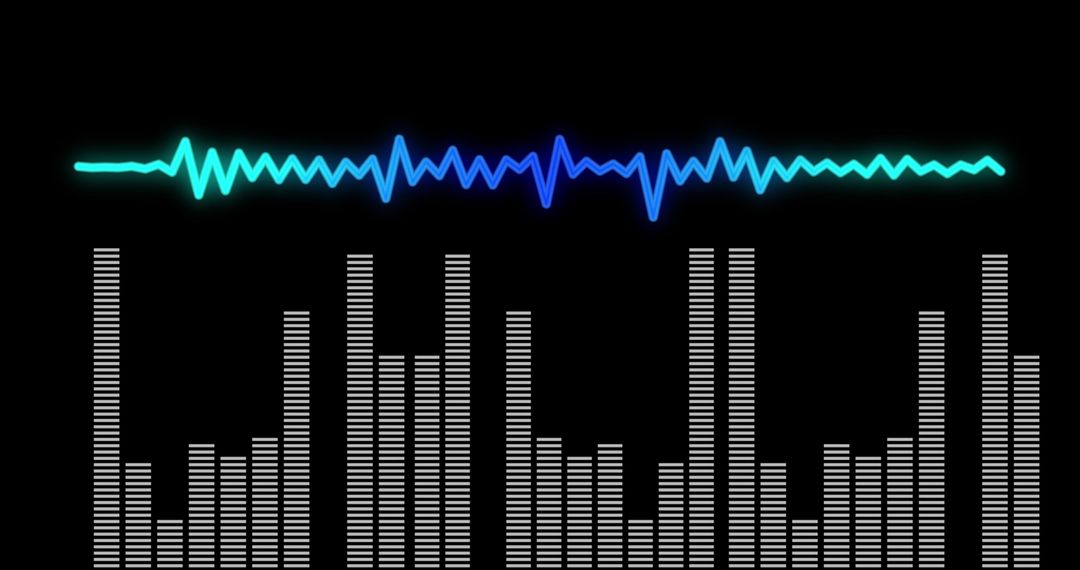
- Digital Financial Data Monitoring on Black Background
Digital Financial Data Monitoring on Black Background Image

Fluctuating neon lines against a black background indicate financial data processing, suitable for themes in global business, fintech innovation, economic analysis, or digital communication visuals. It can be used in presentations or articles on digital finance technology and modern economy analysis.
Powered by  - Get 15% off with code: PIKWIZARD15


2
downloads
downloads
Tags:
More
Credit Photo
If you would like to credit the Photo, here are some ways you can do so
Text Link
photo Link
<span class="text-link">
<span>
<a target="_blank" href=https://pikwizard.com/photo/digital-financial-data-monitoring-on-black-background/d4212c06879a3eac9e1ee0636e66c220/>PikWizard</a>
</span>
</span>
<span class="image-link">
<span
style="margin: 0 0 20px 0; display: inline-block; vertical-align: middle; width: 100%;"
>
<a
target="_blank"
href="https://pikwizard.com/photo/digital-financial-data-monitoring-on-black-background/d4212c06879a3eac9e1ee0636e66c220/"
style="text-decoration: none; font-size: 10px; margin: 0;"
>
<img src="https://pikwizard.com/pw/medium/d4212c06879a3eac9e1ee0636e66c220.jpg" style="margin: 0; width: 100%;" alt="" />
<p style="font-size: 12px; margin: 0;">PikWizard</p>
</a>
</span>
</span>
Free (free of charge)
Free for personal and commercial use.
Author: Awesome Content
Similar Free Stock Images

Premium


Premium


Premium


Premium


Premium


Premium


Premium


Premium


Premium


Premium


Premium


Premium


Premium


Premium


Premium


Premium


Premium


Premium


Premium


Premium


Premium


Premium


Premium


Premium

