1. Home > 
  2. Stock Photos > 
  3. Digital Financial Data on Glass Display over Notepad

Digital Financial Data on Glass Display over Notepad Image

Digital Financial Data on Glass Display over Notepad

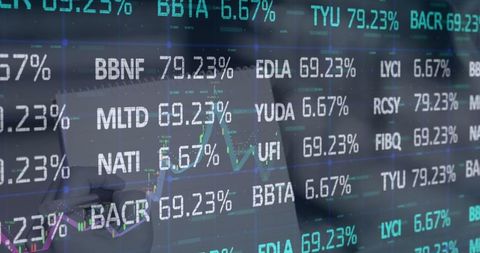
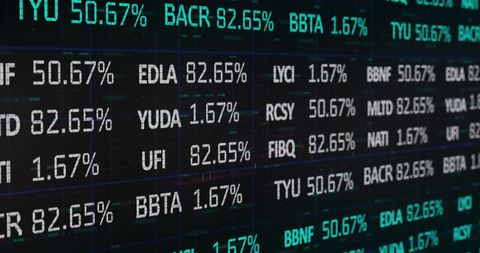
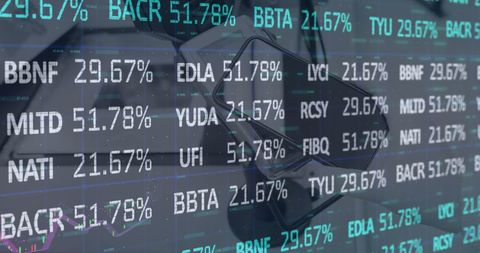
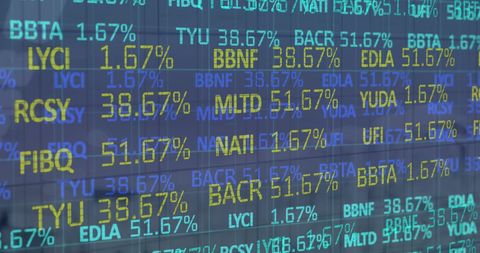
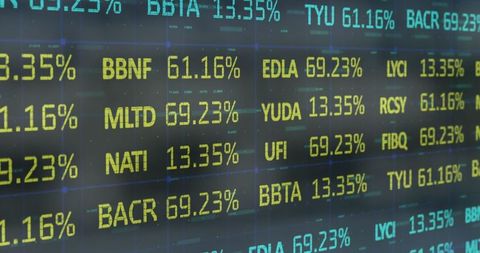
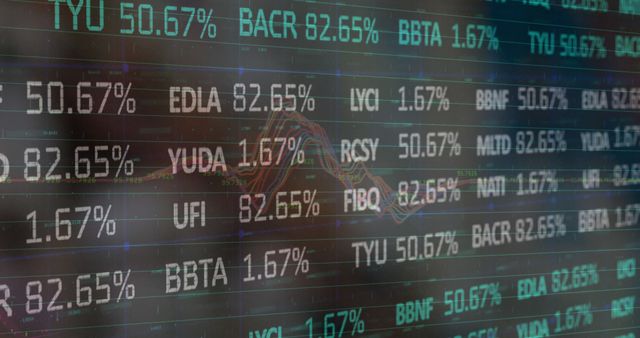
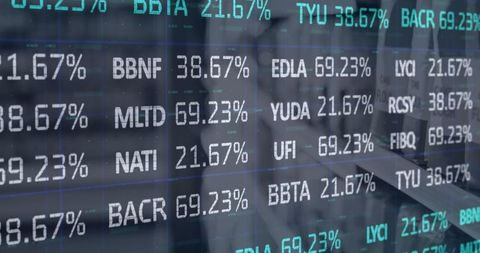
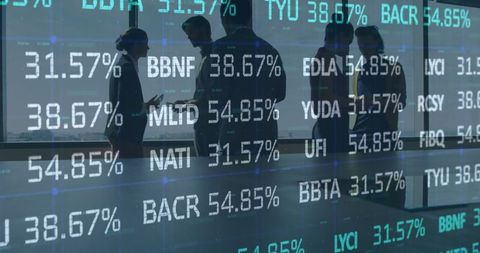
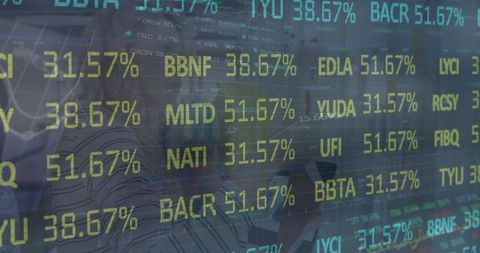
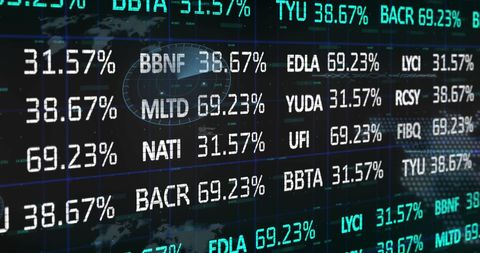
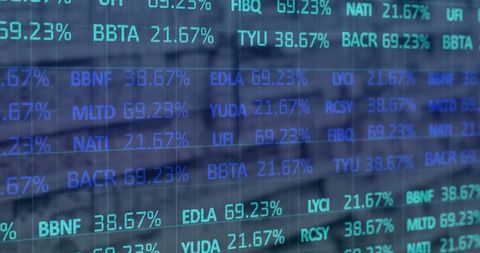
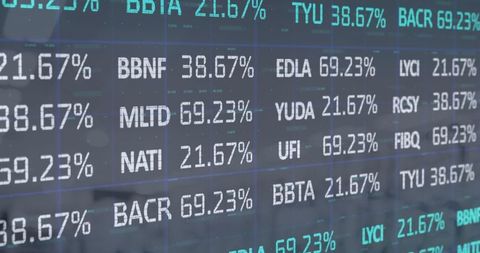
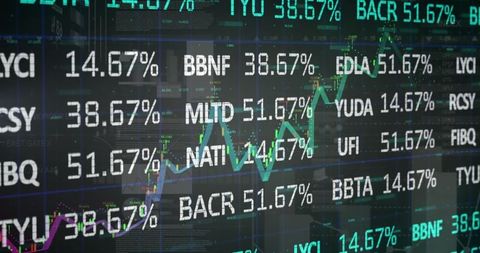
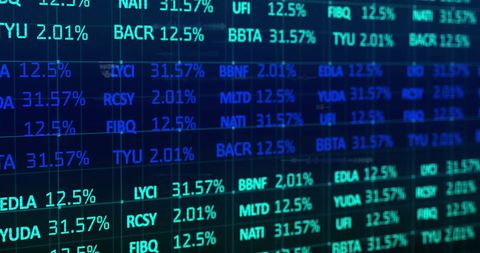
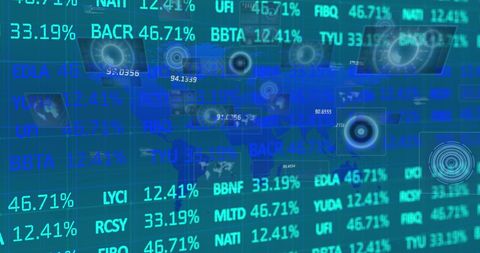
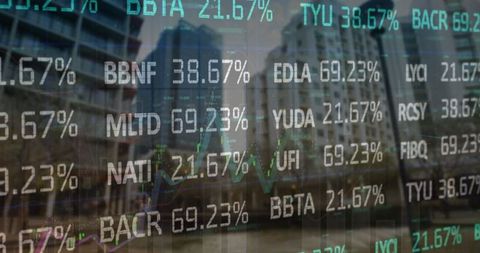
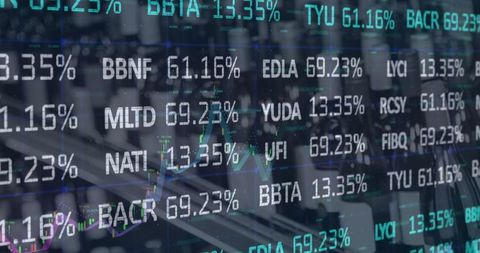
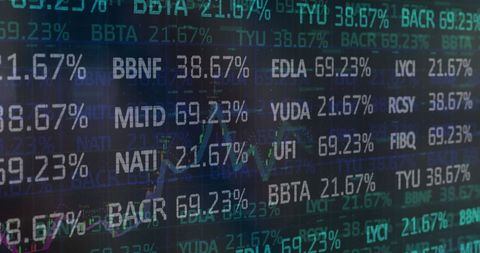
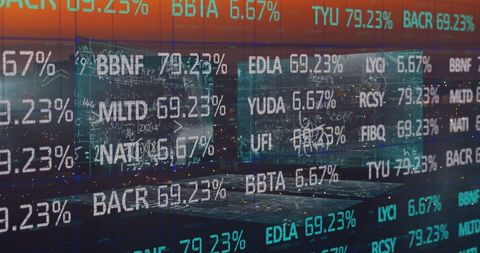
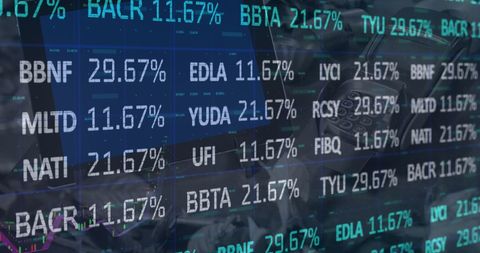
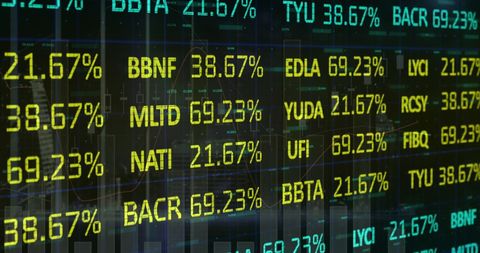
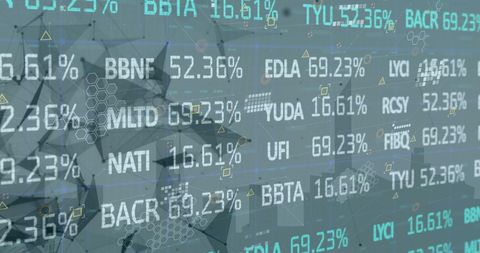
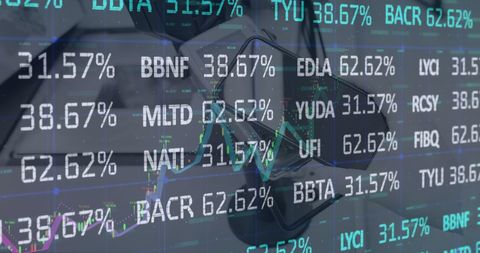
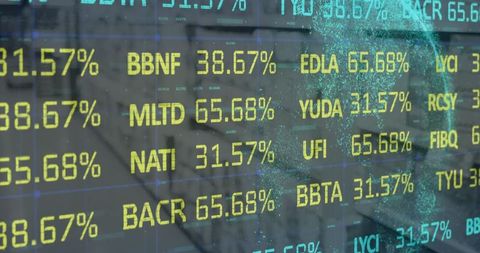
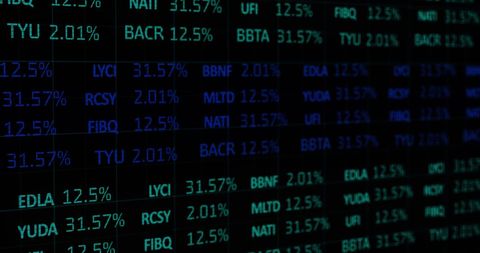
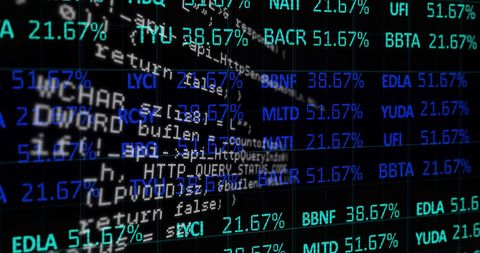
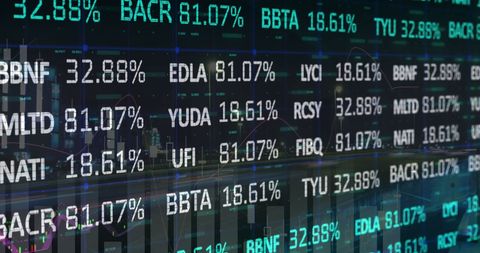
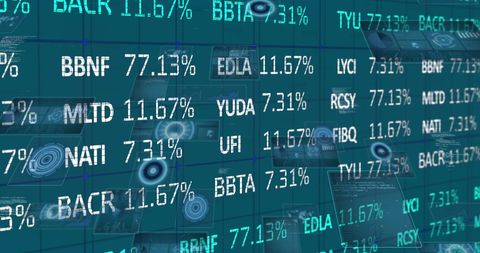
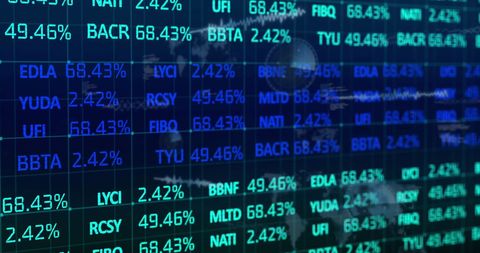
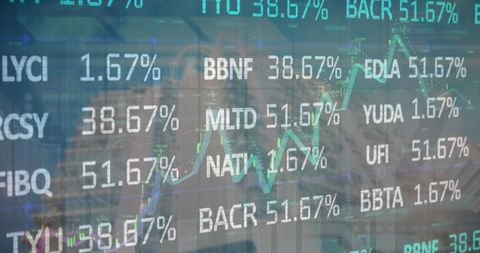
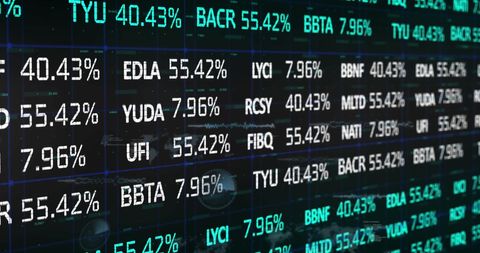
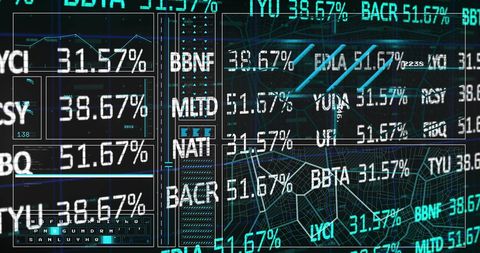
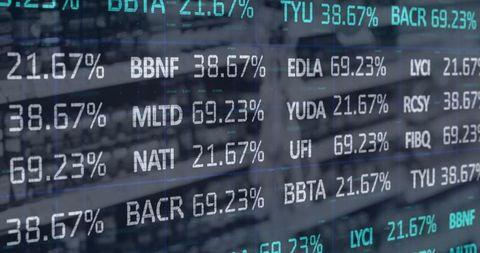
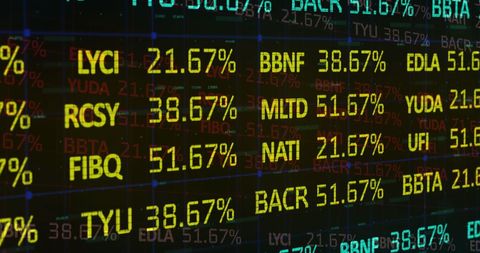
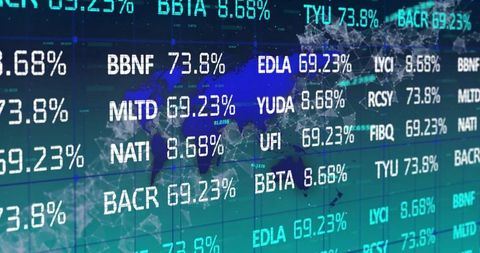
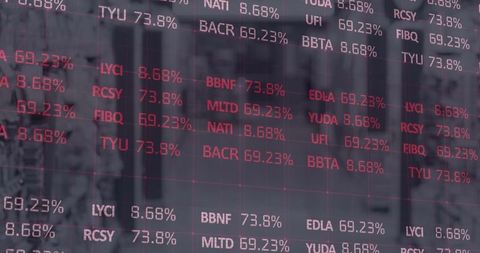
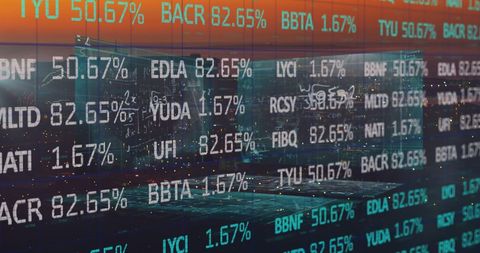
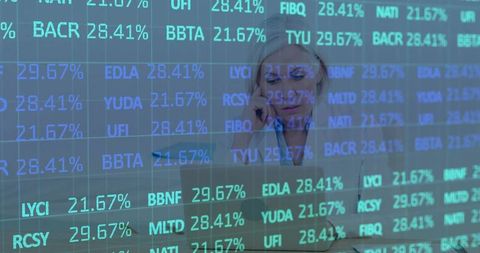
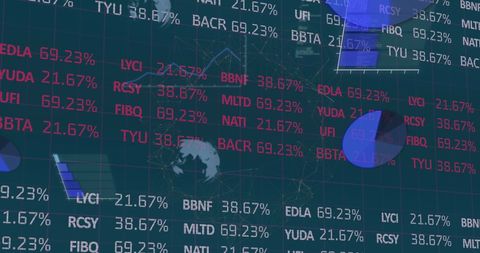
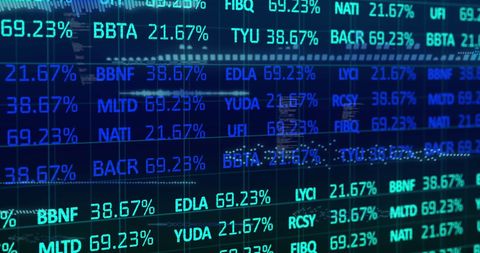
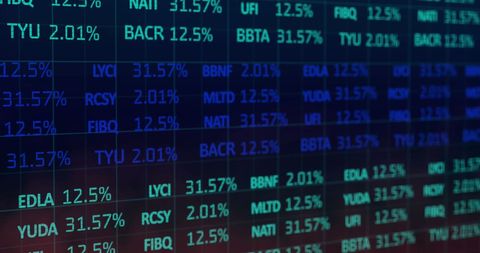
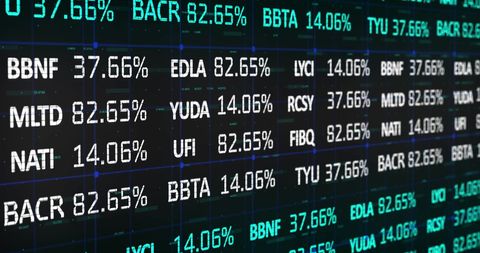
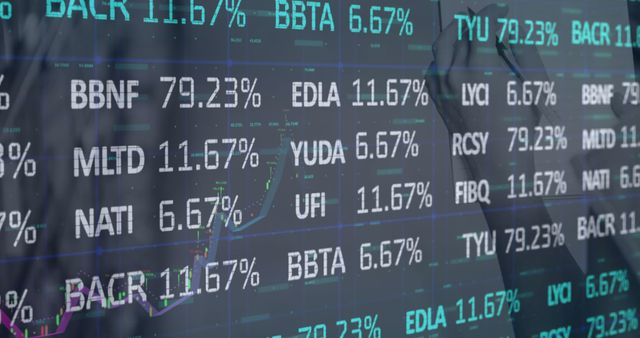
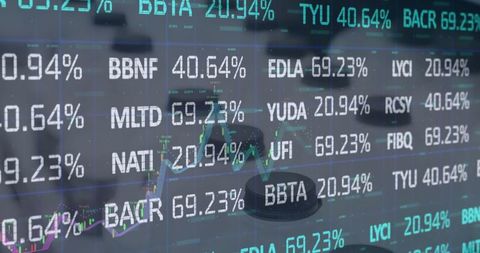
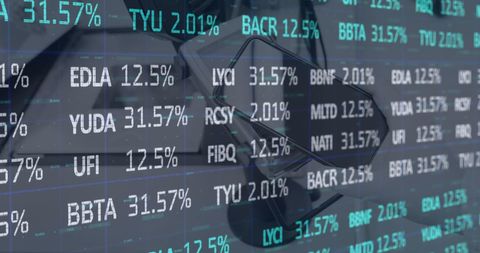
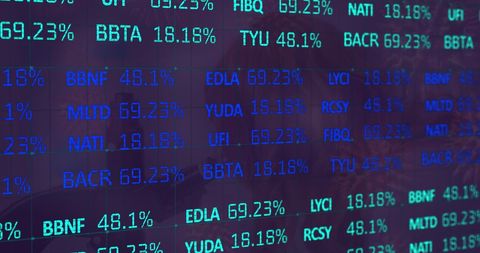
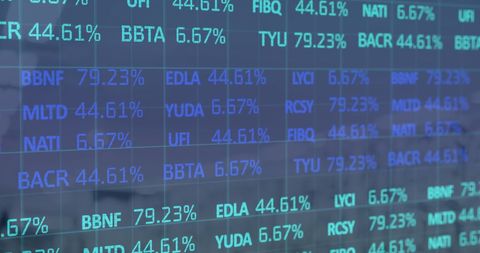
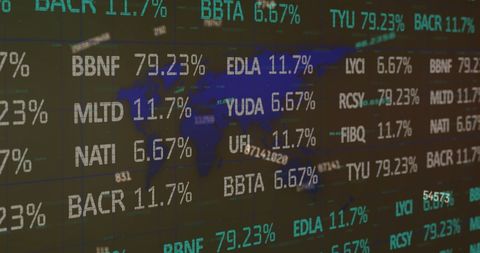
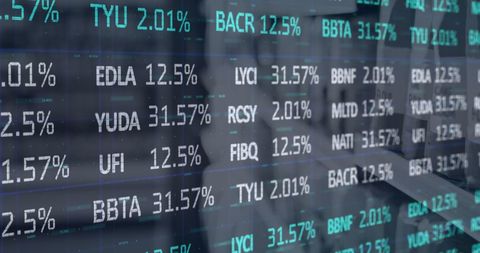
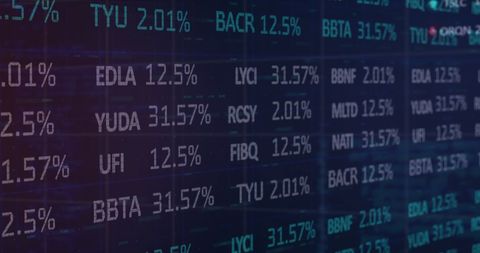
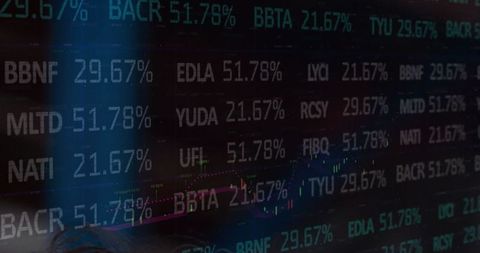
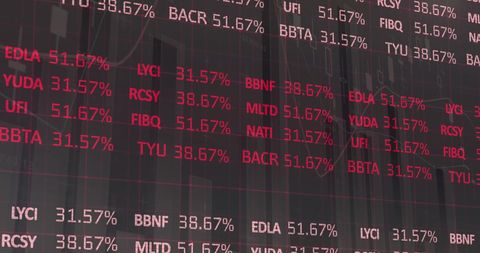
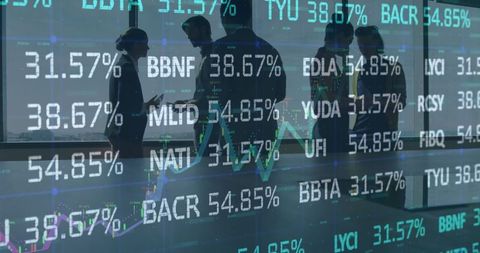
The image presents digital financial data projected onto a notepad, symbolizing the fusion of technology and traditional data analysis. It includes varied percentage figures and stock codes represented in a graphical UI style. Useful for illustrating topics related to/or emphasizing tech integration in financial markets, worldwide stock exchanges information, for reports, presentations, and educational content.

Powered by Shutterstock logo - Get 15% off with code: PIKWIZARD15
Stock market business index orders price on computer screen. Graph of crypto currency online. - Powered by Shutterstock - Get 15% off with code: PIKWIZARD15A financial professional analyzing stock market data on a computer with a digital graph overlay. Background of financial concept - Powered by Shutterstock - Get 15% off with code: PIKWIZARD15Business, finance and investment background. Finance analyst analyzing digital marketing financial report, sale growth with stock market graph, global business planning and market research - Powered by Shutterstock - Get 15% off with code: PIKWIZARD15Business people with stock market chart financial trading, online investment, stock exchange analysis, market trends, real-time trading data, forex and crypto trading economic forecasting tool - Powered by Shutterstock - Get 15% off with code: PIKWIZARD15Analysis finance graph and market chart investment.Trade technology, and investment analysis.Big data chart on city backdrop.Business development, financial plan and strategy. - Powered by Shutterstock - Get 15% off with code: PIKWIZARD15

Credit Photo

If you would like to credit the Photo, here are some ways you can do so

Free (free of charge)

Free for personal and commercial use.

Author: Awesome Content

Similar Free Stock Images

Financial Data Stock Market Ticker in Digital Interface
Premium
Stock market analysis, business, finance and investment. Finance analyst analyzing stock market trading graph, economic growth chart, planning and strategy, business investment with financial report.
Global Stock Market Data Theme with Digital Interface
Premium
Businessman analyzing stock market data analysis with digital charts on laptop and smartphone, financial trends, forex trading strategies, and investment growth.
Premium
Image of stock market data processing over laptop and diary against cityscape. Global economy and business technology concept
Financial Stock Data Interface Overlaying Retail Image
Global Business Finances on Digital Map
Animated Stock Market Ticker Displaying Financial Data
Stock Market Trading Screen with Numeric Display for Financial Analysis
Premium
Data analyzing in forex and stock market trading: the charts and summary info for making trading. Charts of financial instruments for technical analysis.
Digital Stock Market Data Overlay with Smartphone
Financial Data Analysis with Digital Interface Elements
Digital Stock Market Display: Global Finances and Data Insights
Dynamic Stock Market Data with Digital Analysis Grid Concept
Global Financial Statistics And Digital Interface Display
Premium
Global Financial and Economy as concept. Double exposure of currency and stock market chart which suitable for financial investment in Forex market. which including of Pond, Euro, Yen and Dollar.
Stock Market Data Display on Digital Screen
Cityscape Overlaid with Financial Data and Global Business Concept
Digital Stock Ticker with Cityscape at Dusk
World Map with Stock Market Data and Statistical Analysis
World Map with Dynamic Stock Market Data Display
Dynamic Digital Stock Market Display Interface
Stock Market Data and Financial Trading 3D Concept
Financial Data Displayed on Stock Market Electronic Screen
Financial Data Overlay on Shopping Environment Concept
Fluctuating Stock Market Display With Percentages
Global Financial Data Processing and Statistics Visualization
Digital Data Processing on Blue Background
Digital Financial Data Graph with Statistics and Figures
Digital Financial Data Connections on Global Map
Glowing Financial Data Stream Displaying Market Tickers
Global Finance Dashboard Overlay on City Skyline
Stock Market Data Overlay on Smartphone Concept
Dynamic Stock Market Data Display on Digital Grid
Dynamic Stock Market Display with Ticker Symbols and Percentages
Financial Data Overlay on Retail Store Environment
Financial Data Overlay on Business People in Modern Office
Premium
A financial trading chart showing real-time candlestick patterns with fluctuating price movements on a dark screen, indicating market trends and investor sentiment.
Premium
Stock market and forex trading graph on touchscreen showing finance and investment trends, inflation rates, CPI, and economic recession risks Concept of business strategy and global financial analysis
Premium
Image of stock market and statistical data processing over world map against grey background. Global economy and business data technology concept
Dynamic Financial Data Display with Percentage Metrics
Financial Analyst Balancing Devices with Live Market Data Overlay
Digital Financial Data with Percentages on Screen
Business Professionals Analyzing Projected Financial Data
Premium
Stock market or forex trading graph and candlestick chart suitable for financial investment concept. Economy trends background for business idea and all art work design. Abstract finance background.
Digital World Map with Global Financial Technology
Digital Finance Technology Interface Over Retail Shop Interior
Smartphone Reflective Screen Featuring Stock Market Data
Dynamic Stock Market Charts with Financial Data
Premium
Image of statistical and stock market data processing against aerial view of cityscape. Global economy and business data technology concept
Financial Data Streams on Digital Interface
Financial Data and Equations Overlay City Evening View
Digital Stock Market Display with Financial Data and Numbers
Financial Data Display on Digital Screen with Stock Market Indicators
Digital Display with Percentage Values Overlayed on World Map
Stock Market Data Overlay on Smartphone for Finance Concept
Digital Interface and Data Visualization on Blue Background
Digital Data Display with Stock Market Information Grid
Premium
Stock market analysis concept. Trading trading chart. Financial investment. Finance. Forex graph. A man is using a laptop to type on a keyboard. The laptop screen shows a graph of stock prices.
Premium
Finance, account, investment concept. Analyzing stock market data, financial graph report, economic growth, business strategy, planning, solution, currency exchange, market research, economy analysis
Holographic Financial Data Interfaces in Server Environment
Financial Data Display on Digital Stock Market Board
Futuristic Digital Stock Market Display with Dynamic Data Visualization
Digital Data Holographic Interfaces with Stock Exchange Figures
Premium
Stock market investment trading financial, coin  finance business.
Stock Market Data and Technology Display Concept
Financial Data Overlay on Modern Office Background
Digital Display of Stock Market Data Over Laptop
Global Digital Interface and Data Processing on World Map
Global Financial Data Analysis with World Map Overlay and Percent Symbols
Global Financial Data and Statistical Analysis Stream
Financial Data and Mathematical Equations Over Urban Skyline
Financial Data Overlay on Payment Terminal Screen
Financial Data Overlay on Shopping Mall Interiors
Premium
Image of statistical and stock market data processing against aerial view of cityscape. Global economy and business data technology concept
Global Data Processing and Digital Interface Over World Map
Digital Financial Data Overlay in Empty Modern Office
Financial Data Processing with Digital Matrix Networking
Financial Data Visualization with Urban Backdrop
Premium
Futuristic cityscape, rotating earth and dynamic stock market data overlay. Symbolizing the interconnectedness of the global economy and the impact of financial markets on the urban environment.
Global Data Processing Concepts with Digital Interface
Global Finance Digital Interface with World Map and Stock Data
Digital Interface with Scanning Chart Displaying Stock Data
Dynamic Financial Data Display with Real-Time Statistics
Global Financial Data Processing with World Map Overlay
Global Financial Data and Digital Analytics Visualization
Financial Data Visualization on Digital Screen with Statistics
High-Tech Stock Trading Screen with Global Financial Data Overlay
Premium
Display of Stock market quotes with city lights reflect on glass, small focus line
Digital Numbers Displaying Stock Market Data and Analysis
Dynamic Stock Market Financial Data Visualization
Stock Market Graph and Financial Data Display on Building Background
Global Financial Data Analysis with Digital Screen Interface
Premium
Image of rotating globe over financial data and graphs. global finance, economy, and technology concept digitally generated image.
Global Stock Market Data Visualization with Futuristic Elements
Global Market Stocks Reflecting on Glass Display Concept
Digital Display of Financial Data in Vibrant Colors Reflecting Stock Exchange Trends
Digital Financial Metrics in Modern Workspace with Floating Data Overlay
Financial Dashboard with Stock Ticker Symbols and World Map
Digital Stock Market Display with Graphic Indicators
Global Financial Data with World Map and Ticker Overlay
Financial Data Processing Over Digital Overlay of Milk Bottles
Stock Market Data Visualization on Overlay Screen
Complex Financial Data Overlaying Urban Night Skyline
Financial Data Digitally Displayed with Stock Prices
Premium
Stock market, business data analysis, Businessman, finance analyst analyzing business data report and stock market trading graph  with economic growth chart, finance and investment, market research
Global Financial Data Processing and Stock Market Interface
Digital Stock Market Data Displaying Financial Trends
Businesswoman Analyzing Stock Market Data on Digital Interface
Premium
Rendering candlestick chart moving on dashboard with magenta trend line, orange globe, numeric axis. Financial, analytics, digital, technology, data, chart, innovation
Stock Market Data Overlaid with COVID-19 Cells Concept
Stock Market Data Crucial Global Business Trends Interface
Cyber Interface Overlaying Technical Financial Analytics Display
Digital Financial Data Overlay and Retail Connection
Premium
Trade technology, and investment analysis.Business development, financial plan and strategy.Analysis finance graph and market chart investment.
Premium
Foreign data portfolio Investment Equity
Premium
Close up business data on a notebook screen. Stock market trading  information, chart, graph and index data.
Premium
Data analyzing in trading market. Working set for analyzing financial statistics and analyzing a market data. Data analyzing from charts and graph to find out the result.
Premium
FINANCIAL SERVICE concept with Data analyzing in Forex, Commodities, Equities, Fixed Income and Emerging Markets. the charts and summary info show about "Business statistics and Analytics value".
Stock Market Data Visualization on Digital Screen
Digital Financial Data Displayed Over Global Map Background
Financial Data Display Over Cityscape Illustrating Global Markets
Financial Data Displayed on Digital Interface With Cityscape Background
Premium
Financial data and stock market analysis over digital image of graphs and charts. Finance, statistics, performance, investment, economy, business
Business Colleagues Analyzing Financial Market Trends and Data
Explore More Free Stock Images