- Home >
- Stock Photos >
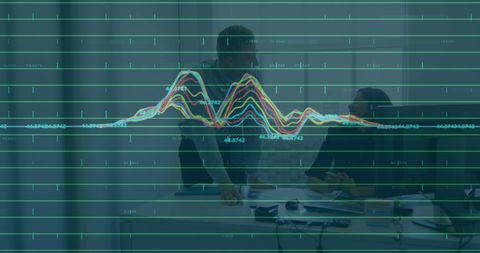
- Digital Financial Data Over Office Documents
Digital Financial Data Over Office Documents Image

Dynamic digital lines representing financial data hover above an office desk filled with documents, illustrating themes of finance and economic analysis. This image is perfect for presentations on financial services, business reports, and illustrating trends in economic data processing and technological applications in finance.

downloads
Tags:
More
Credit Photo
If you would like to credit the Photo, here are some ways you can do so
Text Link
photo Link
<span class="text-link">
<span>
<a target="_blank" href=https://pikwizard.com/photo/digital-financial-data-over-office-documents/98d75b7a995a3d26eda8c06f384814e7/>PikWizard</a>
</span>
</span>
<span class="image-link">
<span
style="margin: 0 0 20px 0; display: inline-block; vertical-align: middle; width: 100%;"
>
<a
target="_blank"
href="https://pikwizard.com/photo/digital-financial-data-over-office-documents/98d75b7a995a3d26eda8c06f384814e7/"
style="text-decoration: none; font-size: 10px; margin: 0;"
>
<img src="https://pikwizard.com/pw/medium/98d75b7a995a3d26eda8c06f384814e7.jpg" style="margin: 0; width: 100%;" alt="" />
<p style="font-size: 12px; margin: 0;">PikWizard</p>
</a>
</span>
</span>
Free (free of charge)
Free for personal and commercial use.
Author: People Creations