
- Home >
- Stock Photos >
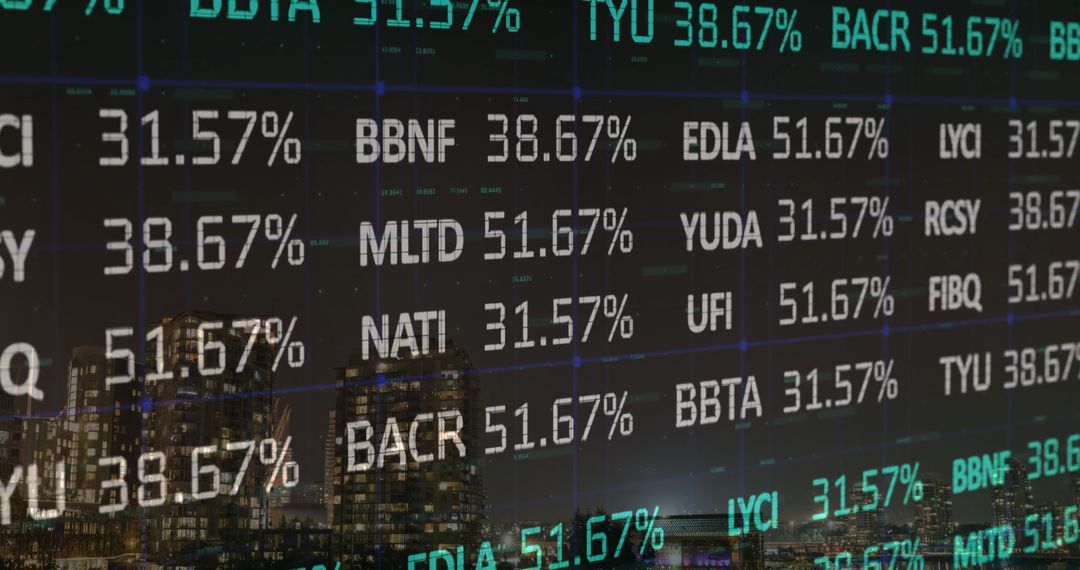
- Digital Financial Data Overlaid on Equations
Digital Financial Data Overlaid on Equations Image
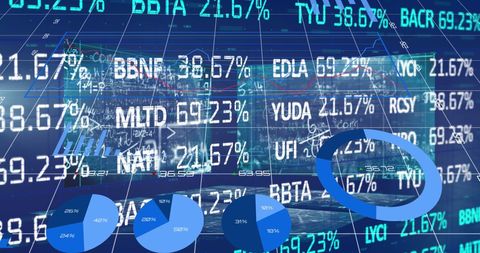
Financial data graphics are overlaid with mathematical equations, creating a dynamic and analytical theme. Perfect resource for presentations on economic analysis, financial forecasts, investment strategies, and business reports. Suitable for illustrating trends in global markets or digital interfaces in economic contexts.
Powered by  - Get 15% off with code: PIKWIZARD15


2
downloads
downloads
Tags:
More
Credit Photo
If you would like to credit the Photo, here are some ways you can do so
Text Link
photo Link
<span class="text-link">
<span>
<a target="_blank" href=https://pikwizard.com/photo/digital-financial-data-overlaid-on-equations/c72db9690e5c56b15a038fa9929051d4/>PikWizard</a>
</span>
</span>
<span class="image-link">
<span
style="margin: 0 0 20px 0; display: inline-block; vertical-align: middle; width: 100%;"
>
<a
target="_blank"
href="https://pikwizard.com/photo/digital-financial-data-overlaid-on-equations/c72db9690e5c56b15a038fa9929051d4/"
style="text-decoration: none; font-size: 10px; margin: 0;"
>
<img src="https://pikwizard.com/pw/medium/c72db9690e5c56b15a038fa9929051d4.jpg" style="margin: 0; width: 100%;" alt="" />
<p style="font-size: 12px; margin: 0;">PikWizard</p>
</a>
</span>
</span>
Free (free of charge)
Free for personal and commercial use.
Author: Creative Art
Similar Free Stock Images

Premium


Premium


Premium


Premium


Premium


Premium


Premium


Premium


Premium


Premium


Premium


Premium


Premium


Premium


Premium


Premium


Premium


Premium


Premium


Premium


Premium


Premium


Premium


Premium

