- Home >
- Stock Photos >
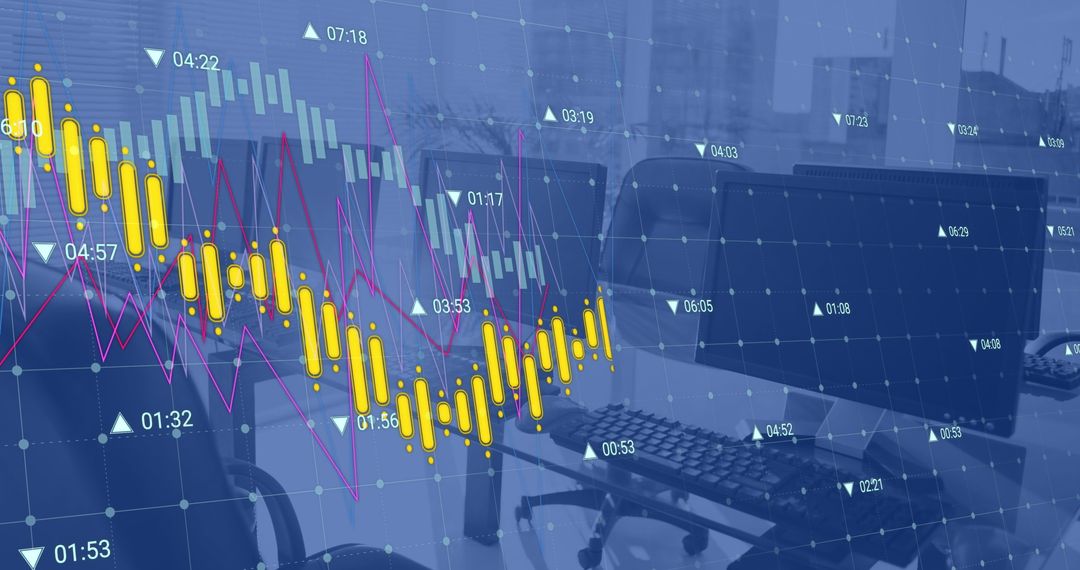
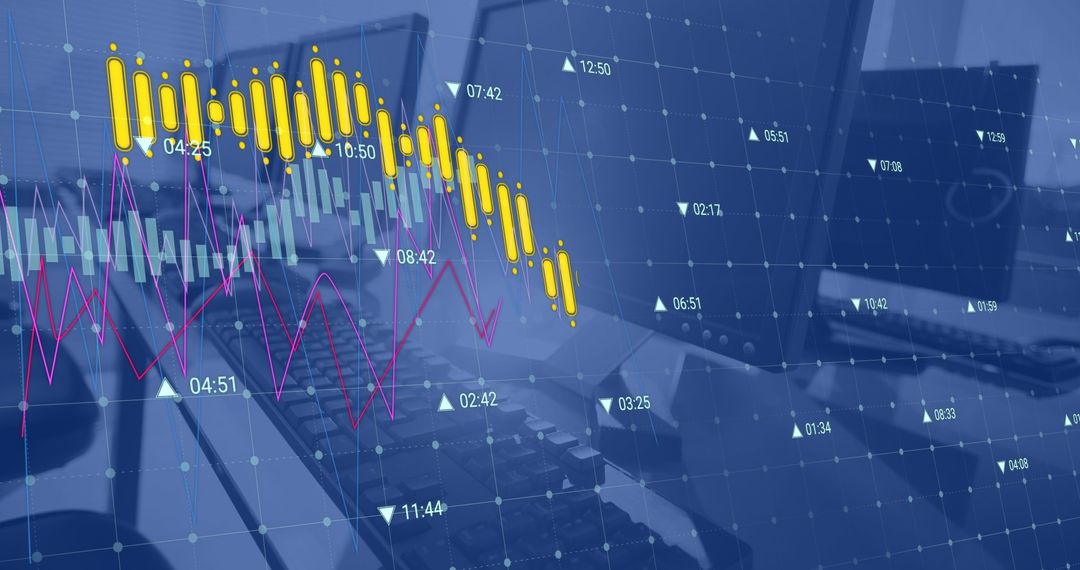
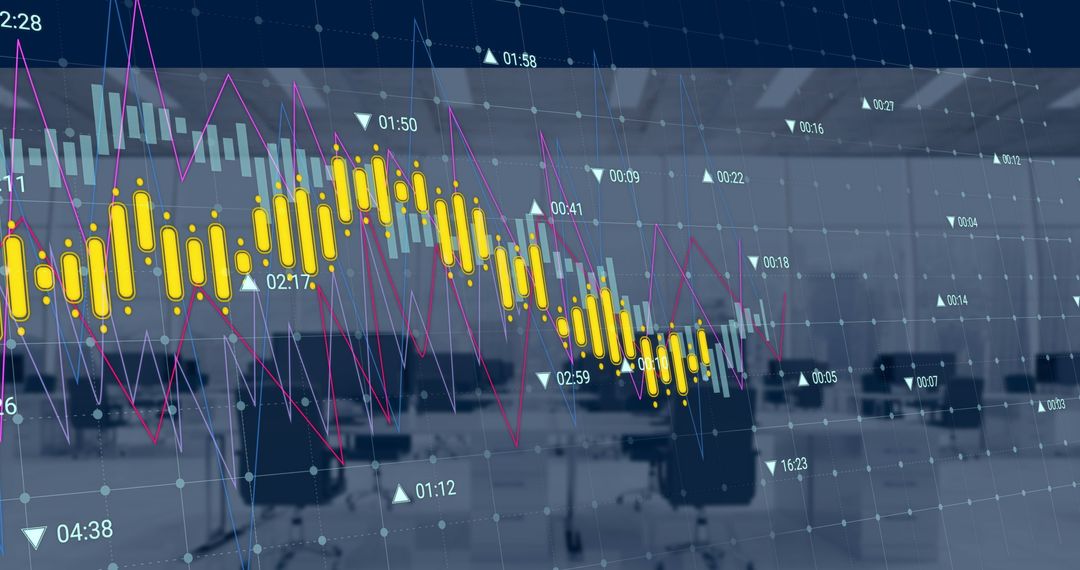
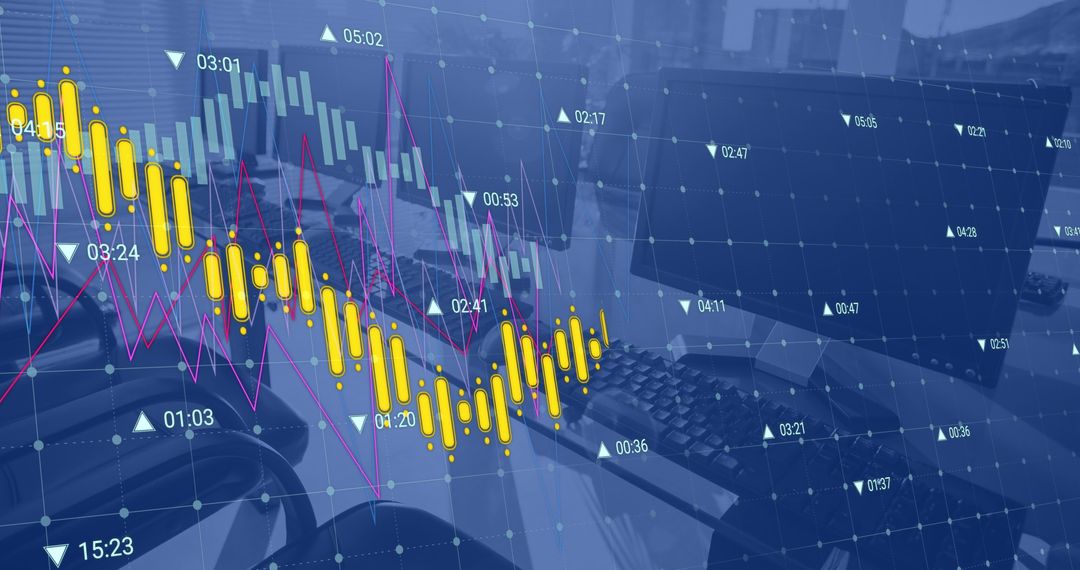
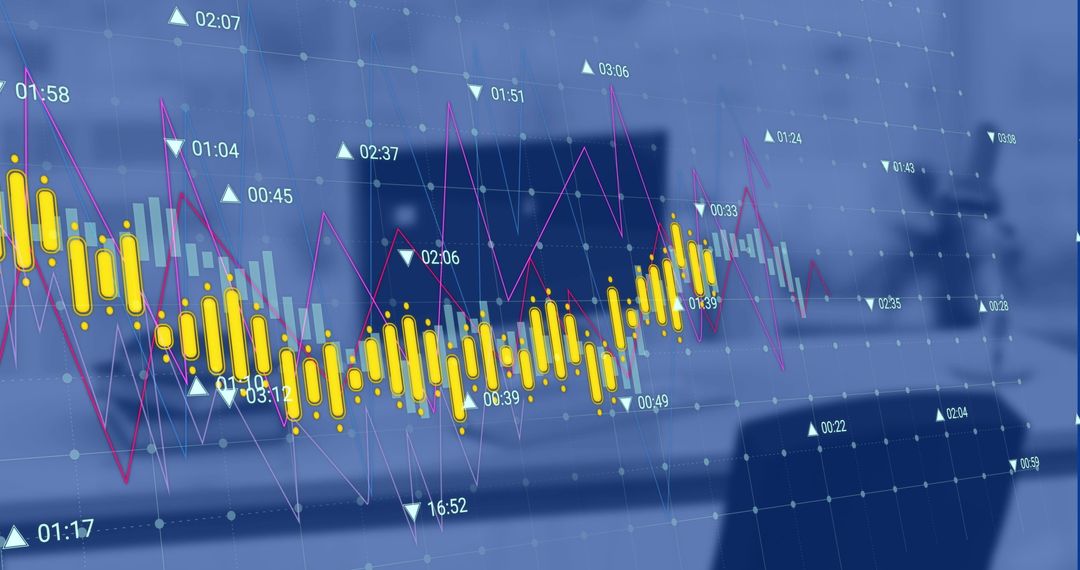
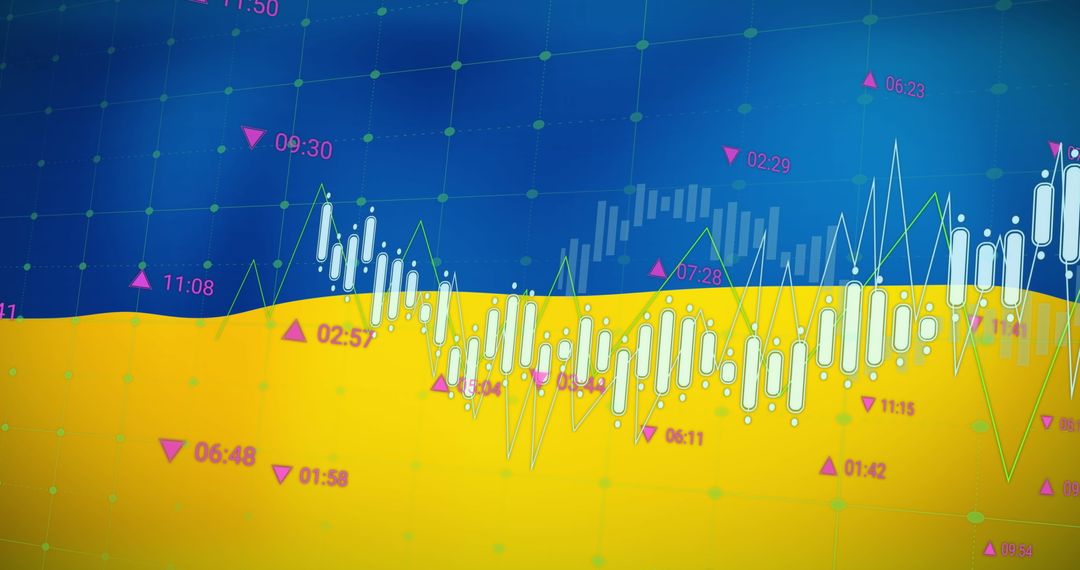
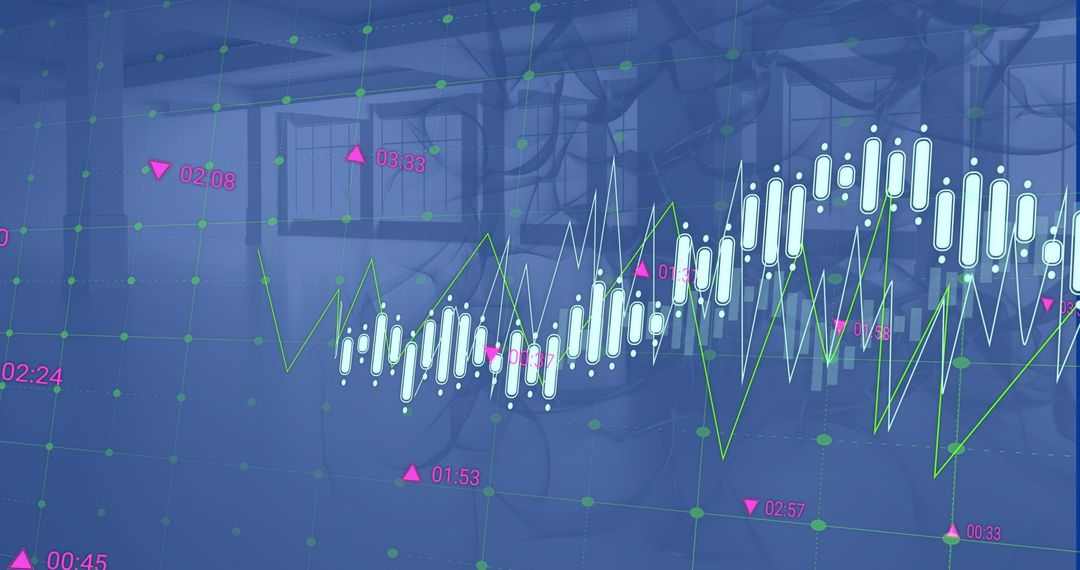
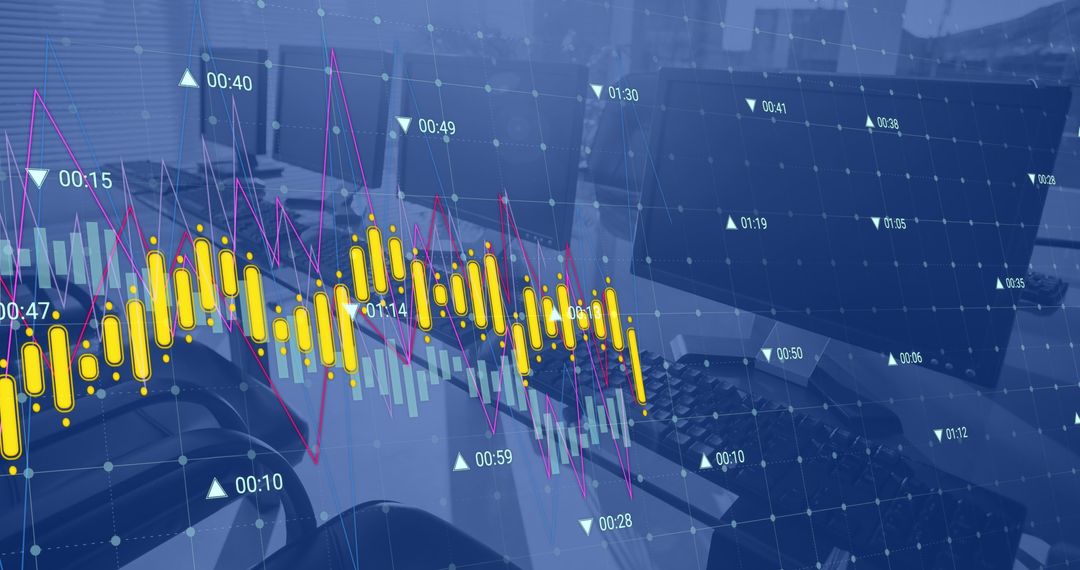
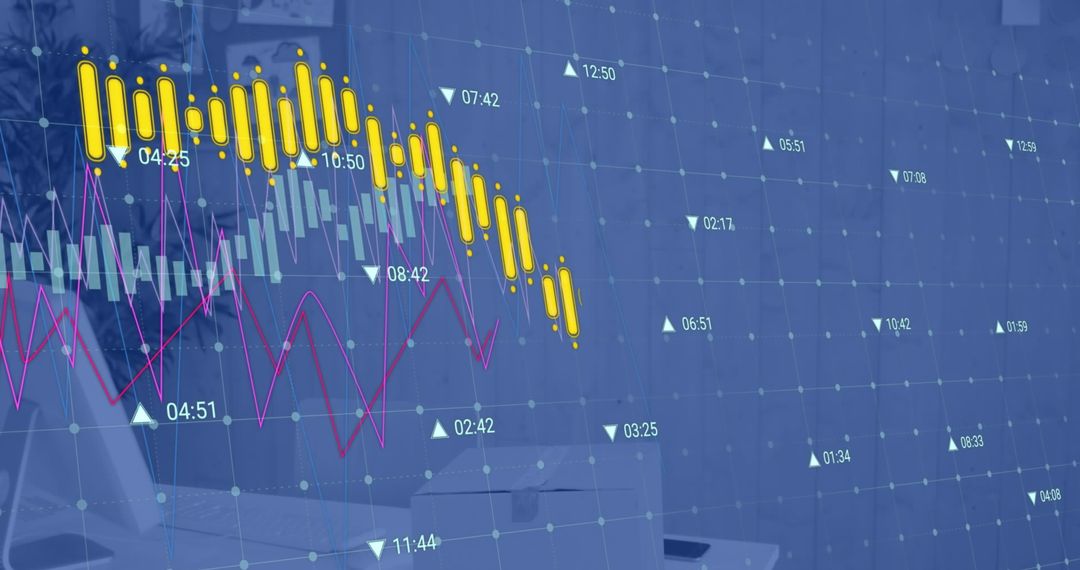
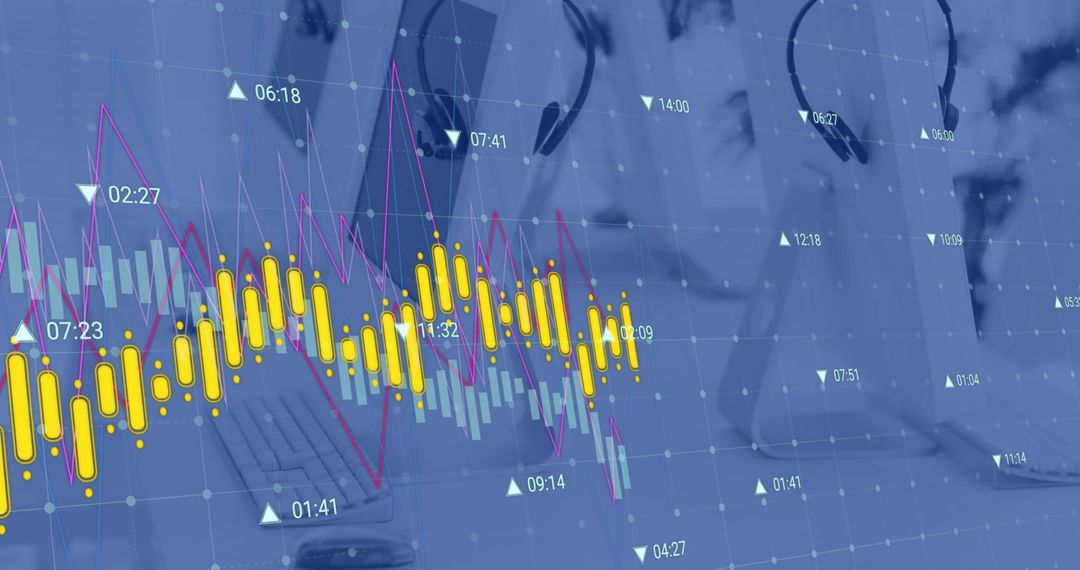
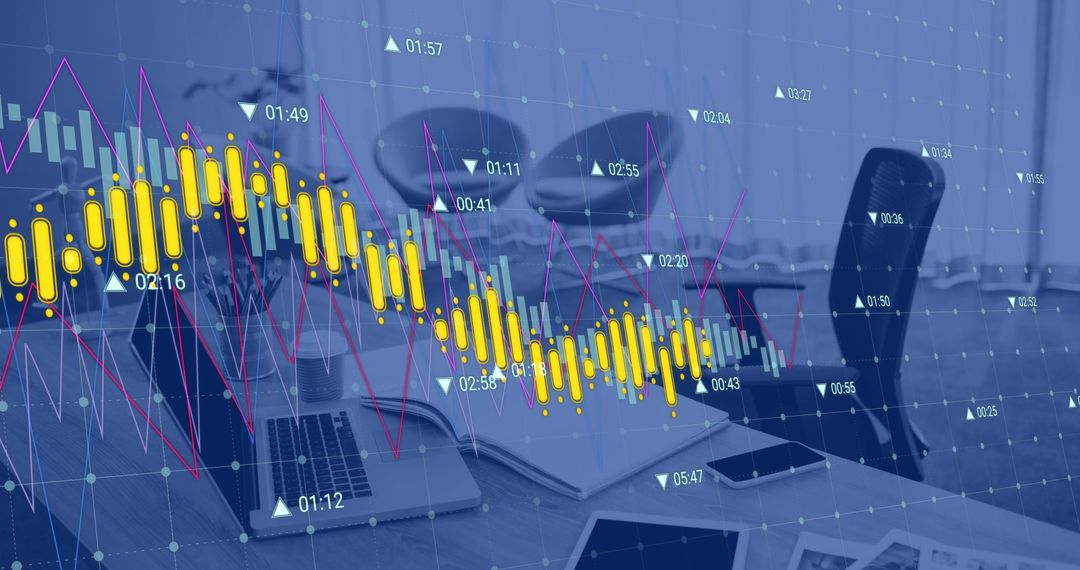
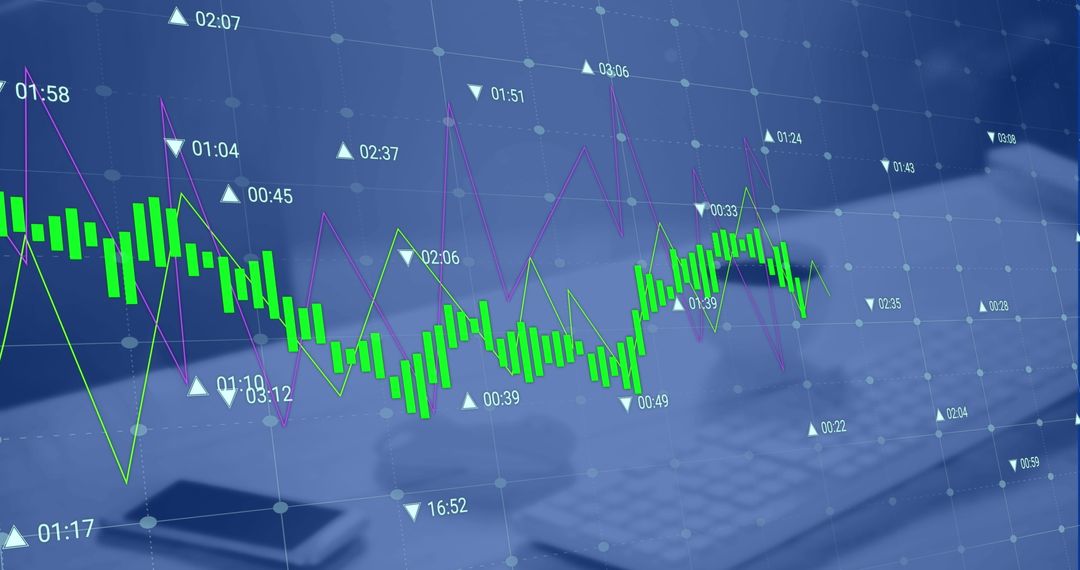
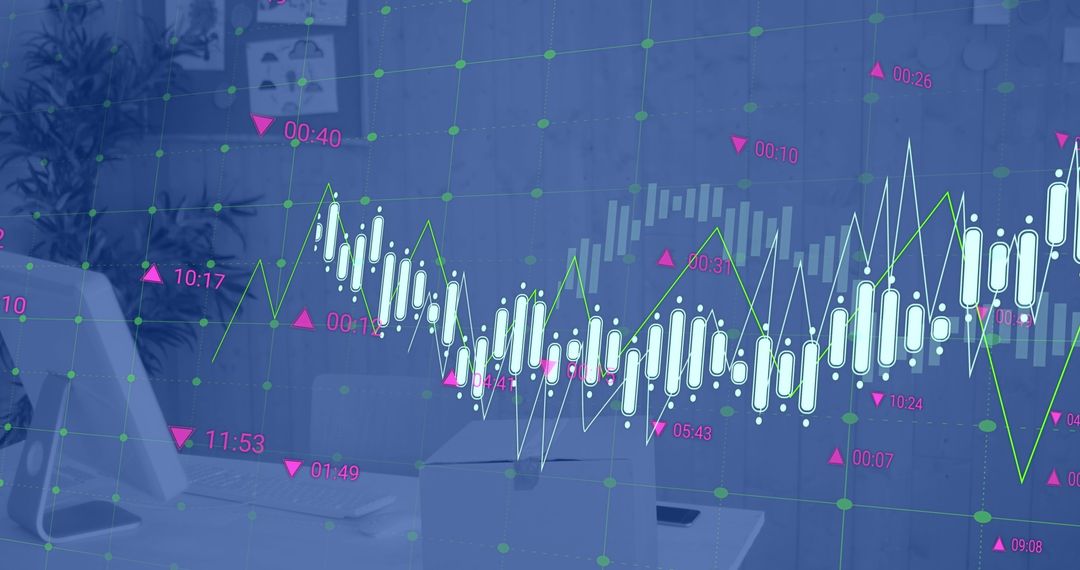
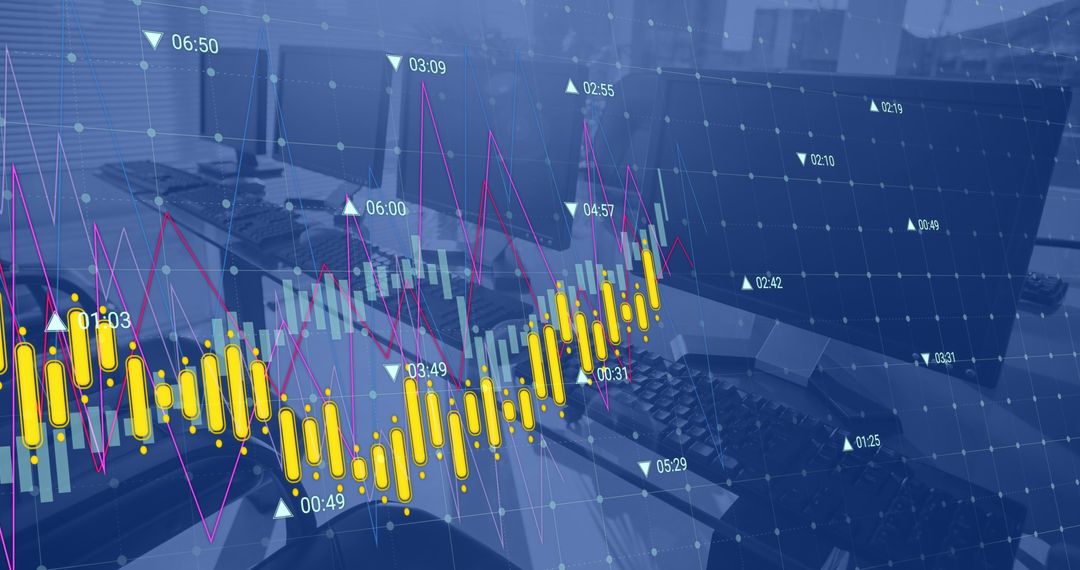
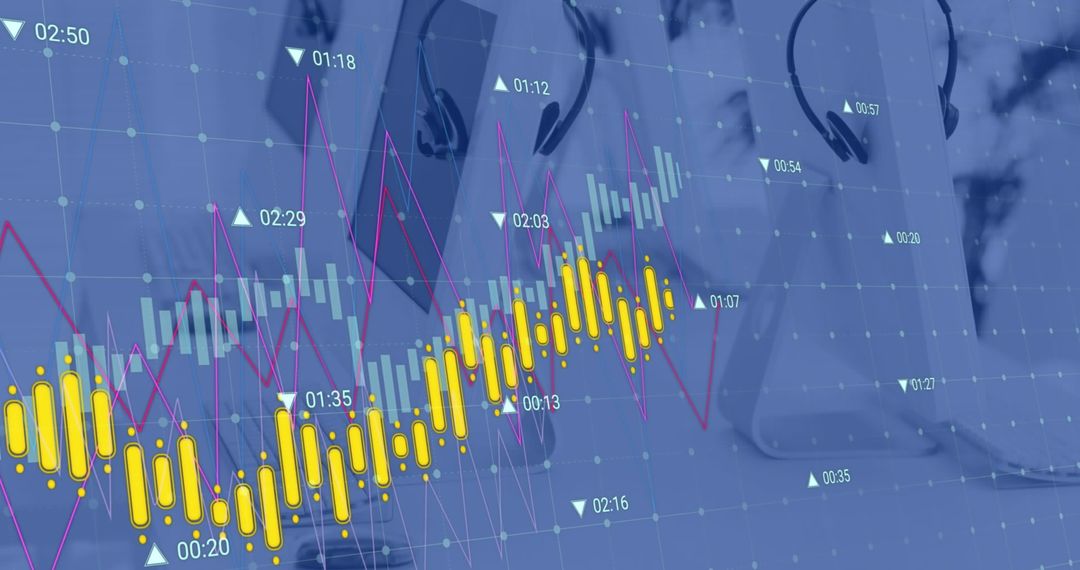
- Digital Financial Data Overlaid on Office Desk
Digital Financial Data Overlaid on Office Desk Image
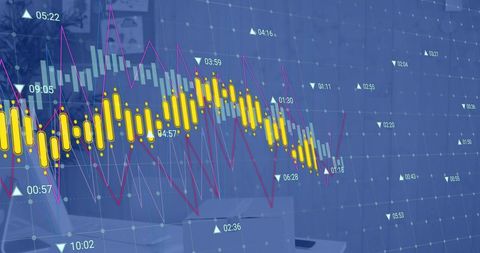
This visualization of financial data displays a graph overlay on an office desk, suggesting a modern approach to global business and finance. The combination of digital data points and an office environment conveys technology integration in investment strategies. Ideal for usage in presentations on business analysis, financial forecasting, and technological advancements in the industry.
Powered by 


4
downloads
downloads
Tags:
More
Credit Photo
If you would like to credit the Photo, here are some ways you can do so
Text Link
photo Link
<span class="text-link">
<span>
<a target="_blank" href=https://pikwizard.com/photo/digital-financial-data-overlaid-on-office-desk/72a3d2e9ed813e223e492a82dedcb3a7/>PikWizard</a>
</span>
</span>
<span class="image-link">
<span
style="margin: 0 0 20px 0; display: inline-block; vertical-align: middle; width: 100%;"
>
<a
target="_blank"
href="https://pikwizard.com/photo/digital-financial-data-overlaid-on-office-desk/72a3d2e9ed813e223e492a82dedcb3a7/"
style="text-decoration: none; font-size: 10px; margin: 0;"
>
<img src="https://pikwizard.com/pw/medium/72a3d2e9ed813e223e492a82dedcb3a7.jpg" style="margin: 0; width: 100%;" alt="" />
<p style="font-size: 12px; margin: 0;">PikWizard</p>
</a>
</span>
</span>
Free (free of charge)
Free for personal and commercial use.
Author: Awesome Content
Similar Free Stock Images

Premium


Premium


Premium


Premium


Premium


Premium


Premium


Premium


Premium


Premium


Premium


Premium


Premium


Premium


Premium

Premium


Premium


Premium


Premium


Premium


Premium


Premium


Premium


Premium