- Home >
- Stock Photos >
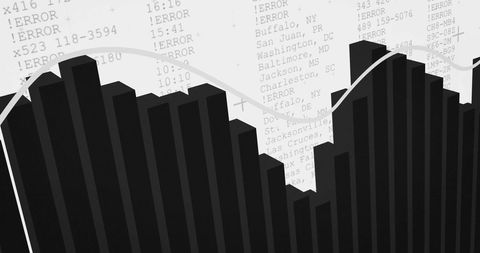
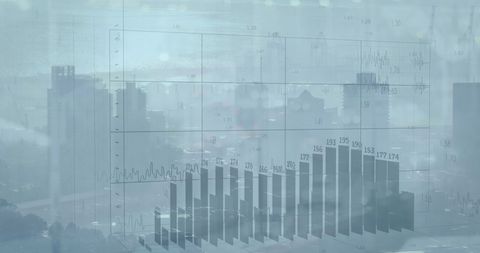
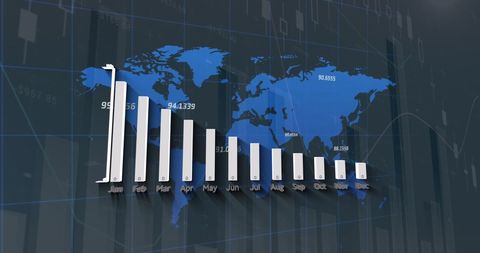
- Digital Financial Data Overlaps with Graph Analytics
Digital Financial Data Overlaps with Graph Analytics Image

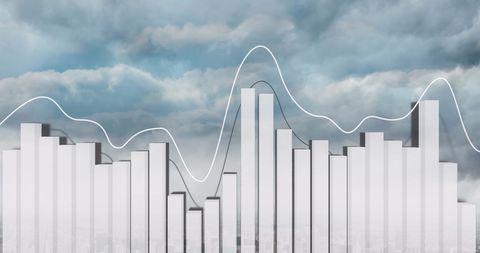
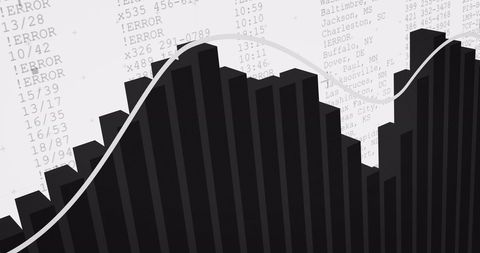
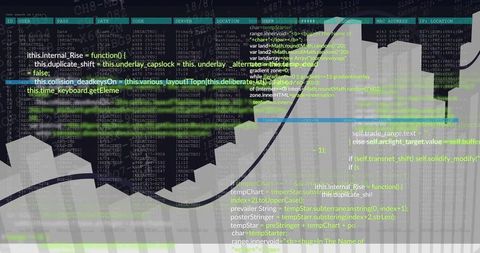
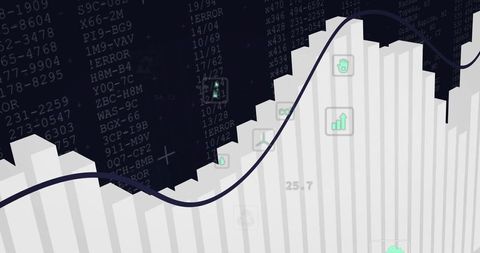
This image illustrates a digital overlay of financial data combined with bar graphs that indicate analytics. The presence of numerical errors adds emphasis on the complexity of data processing in modern finance environments. Ideal for use in financial presentations, technology blogs related to business intelligence, or articles delving into the challenges and innovations of financial data management.

downloads
Tags:
More
Credit Photo
If you would like to credit the Photo, here are some ways you can do so
Text Link
photo Link
<span class="text-link">
<span>
<a target="_blank" href=https://pikwizard.com/photo/digital-financial-data-overlaps-with-graph-analytics/fbfa86eeefcc467923ed33b014375b40/>PikWizard</a>
</span>
</span>
<span class="image-link">
<span
style="margin: 0 0 20px 0; display: inline-block; vertical-align: middle; width: 100%;"
>
<a
target="_blank"
href="https://pikwizard.com/photo/digital-financial-data-overlaps-with-graph-analytics/fbfa86eeefcc467923ed33b014375b40/"
style="text-decoration: none; font-size: 10px; margin: 0;"
>
<img src="https://pikwizard.com/pw/medium/fbfa86eeefcc467923ed33b014375b40.jpg" style="margin: 0; width: 100%;" alt="" />
<p style="font-size: 12px; margin: 0;">PikWizard</p>
</a>
</span>
</span>
Free (free of charge)
Free for personal and commercial use.
Author: People Creations