
- Home >
- Stock Photos >
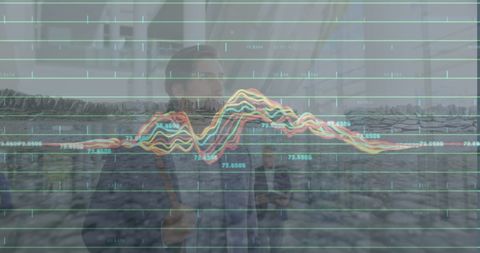
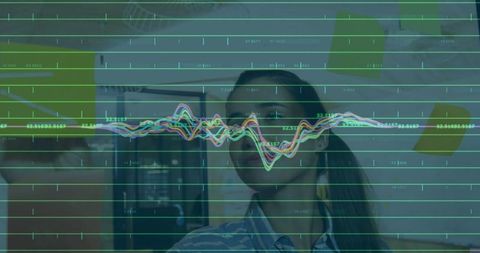
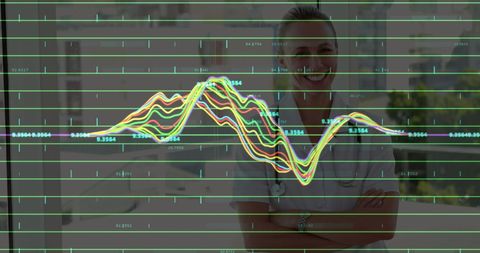
- Digital Financial Data Overlay on Retail Environment
Digital Financial Data Overlay on Retail Environment Image

Financial data graphs overlaid on a retail environment depict data-driven business operations in a global shopping context. Useful for illustrating modern digital finance, technology integration in retail, and innovative business strategies. Ideal for presentations on financial analysis, retail technology solutions, or futurist commerce strategies.
Powered by 


downloads
Tags:
More
Credit Photo
If you would like to credit the Photo, here are some ways you can do so
Text Link
photo Link
<span class="text-link">
<span>
<a target="_blank" href=https://pikwizard.com/photo/digital-financial-data-overlay-on-retail-environment/e1062e23bcd4d697c0c3239a8a3a03e8/>PikWizard</a>
</span>
</span>
<span class="image-link">
<span
style="margin: 0 0 20px 0; display: inline-block; vertical-align: middle; width: 100%;"
>
<a
target="_blank"
href="https://pikwizard.com/photo/digital-financial-data-overlay-on-retail-environment/e1062e23bcd4d697c0c3239a8a3a03e8/"
style="text-decoration: none; font-size: 10px; margin: 0;"
>
<img src="https://pikwizard.com/pw/medium/e1062e23bcd4d697c0c3239a8a3a03e8.jpg" style="margin: 0; width: 100%;" alt="" />
<p style="font-size: 12px; margin: 0;">PikWizard</p>
</a>
</span>
</span>
Free (free of charge)
Free for personal and commercial use.
Author: Creative Art
Similar Free Stock Images

Premium


Premium


Premium


Premium


Premium


Premium


Premium


Premium


Premium


Premium


Premium


Premium

Premium


Premium


Premium

Premium


Premium

Premium


Premium


Premium


Premium

Premium
Premium


Premium


Premium


Explore More Free Stock Images