1. Home > 
  2. Stock Photos > 
  3. Digital Financial Data Processing and Analysis Graphics

Digital Financial Data Processing and Analysis Graphics Image

Digital Financial Data Processing and Analysis Graphics

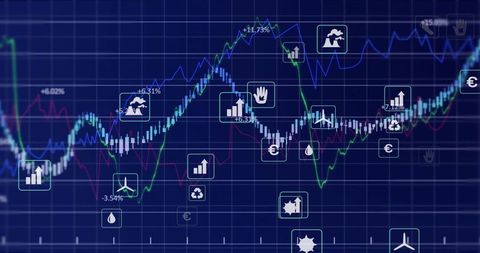
This digitally generated art shows a range of statistical graphics including bar charts, line graphs, and data grids. Ideal for use in presentations on financial analysis, investment strategies, or business decision-making models. Suitable for brochures promoting financial services, educational content on data analytics, and software interfaces demonstrating digital data processing capabilities.

Powered by Adobe logo
Businesswoman typing on laptop with digital financial chart overlay, representing data analysis, stock market trends, economic growth, investment, business strategy, and modern technology. - Powered by Adobebusiness statistics info graphics, pie charts, bar graphs, and numerical data, business growth analysis  - Powered by AdobeProfessional analyst reviews dynamic financial data visualizations on a modern laptop, driving business growth and informed decisions. - Powered by AdobeHand holding magnifying glass over glowing digital financial chart with data analysis and growth trends on dark background - Powered by AdobeBusiness people analyzing financial charts and graphs at meeting - Powered by Adobe

Credit Photo

If you would like to credit the Photo, here are some ways you can do so

Free (free of charge)

Free for personal and commercial use.

Author: Awesome Content

Similar Free Stock Images

Financial Data Processing Over Digital Interface and Graphs
Premium
Abstract representation of financial growth with glowing graphs and data patterns in dark background
Abstract Digital Stock Market Interface with Graphs and Data
Premium
Business finance data analytics graph.Financial management technology.Advisor using KPI Dashboard on virtual screen.
Premium
Cropped unrecognizable person analyzing financial data on tablet. Generative AI image
Dynamic Stock Market Trends and Financial Data Graph
Financial Data Analysis with Bar and Line Graph Elements
Displaying Cyan Bar and Magenta Line Analytics Over Server Log Data on Dark Neon Dashboard
Financial Graphs and World Map Illustrating Market Data
Premium
Data science and big data technology. Data scientist computing, analysing and visualizing complex data set on computer. Data mining, artificial intelligence, machine learning, business analytics.
Rising Graphs and Interactive Financial Data Analytics Background
Stock Market Analysis with Graphs and Trading Data
Global Data Processing with Dynamic Graph Visualization
Digital Stock Market Data and Trends Visualization
Premium
Data Examination: A magnifying glass hovers over financial reports and charts on a sky-blue surface, providing an overview of the business analysis.
Global Financial Data and Stock Market Trends on World Map
Dynamic Financial Data Analysis and Graphs for Market Trends
Digital Finance Art with Graphs and Currency Symbols Overlapping
Dynamic Financial Data Processing in Modern Analytics
Premium
AI finance business data analysis digital technology investment trading market stock, financial analyst using advanced holographic interface for global market insight, smart investment strategy
Digital Financial Charting and Data Processing on Black Background
Financial Analytics Dashboard with Growth Trends and Indicators
Financial Data Charts with Network Connections Digital Interface
Digital Financial Data Analytics and Economic Trends
Premium
Business audit stock financial finance management on analysis data strategy with graph accounting marketing or report chart economy investment research profit concept.
Futuristic Data Trend Graphs on Digital Interface
Colorful Financial Data Charts on Digital Grid Background
NFT Trading Analytics Dashboard with Graphs and Data Metrics
Digital Stock Market Chart and Networking Interface
Premium
Laptop, investment graphs and business woman reading IPO analytics, financial bank chart or accounting value, info or stocks. Trade price, admin data analysis and profile of broker review statistics
Premium
Business strategy analysis data, Analyst database development analytic. Business, Analytics and Data Management System on computer, make report KPI and metrics connected database
Digital Financial Data Analysis with Infographics and Charts
Dynamic Digital Data Dashboard with Analytics Charts and Graphs
Financial Data Stock Analysis with Code Overlays
Digital Financial Graphs and Data Analysis Visualization
Dynamic Digital Data Processing and Analysis Graphs
Economic Trends Analysis with Financial Indicators and Graphs
Premium
Business intelligence analyst dashboard on virtual screen. Big data Graphs Charts.
Digital Financial Data Visualizations on Black Background
Digital Dashboard with Data Trends and Chat Technology Elements
Dynamic Financial Data Analytics Display with Graphs
Innovative Digital Finance Data Display on Dark Interface
Abstract Financial Graph Display on Dark Background
Premium

Dynamic blue and green digital stock market graph with bar charts and lines on a dark background, representing financial data analysis, investment trends, business growth, and global economy fluctuat
Colorful Financial Data Visualization on Digital Grid
Futuristic Data Dashboard with Graphs and Numeric Visuals
Digital Financial Data Interface with Graphs and Trends
Digital Chart Display Financial Data Analysis Background Effects
Rising Stock Market Trends and Chart Analysis
Premium
Data analysis science and big data with AI technology. Analyst or Scientist uses a computer and dashboard for analysis of information on complex data sets on computer. Insights development engineer
Cybersecurity Dashboard With Data and Code Elements Display
Dynamic Data Visualization with Financial Charts and 3D Elements
Financial Data Processing with Graphs and Charts Background
Digital Data Visualization and Analysis Interface
Premium
Abstract digital stock market chart with glowing blue lines and bokeh effects representing financial growth and analysis.
Financial Data Analysis in Digital Interface with Graphs
Financial Analytics Data Visualization with Graphs and Charts
Futuristic Financial Data Analysis with Graphs and Charts
Fluctuating Red Line on Digital Analytics Dashboard
Premium
A business professional engages with a tablet, analyzing financial data presented through interactive charts and graphs, enhancing strategic insights for decision making. Scalp
Dynamic Digital Stock Market Chart with Growing Financial Trends
Holographic Stock Market Analysis with Charts and Data
Encrypted Data on Digital Interface with Analytics Charts
Digital Display of Financial Data with Graph and Figures
Premium
A focused individual analyzes digital financial data on a futuristic interface, highlighting trends and insights with a finger gesture.
Digital Stock Market Trends and Financial Growth Analysis
Dynamic Financial Data Analysis with Virtual Screen
Financial Chart with Dynamic Data on Black Grid
Displaying Financial Dashboard with Candlestick Charts, Trend Lines and Economic Icons
Digital Projection of Financial Data with Bar Graphs
Premium
Business professionals collaborating and analyzing financial data on a laptop with charts and graphs during a meeting
Declining Graph with 49% Reduction on Dark Digital Background
Digital Analytics Interface with Data Trends and Performance Metrics
Financial Data Analysis with Interactive Graphs
Dynamic Financial Graph Displaying Market Trends
Premium
In-depth business analysis captured through vibrant pie charts and bar graphs on a document, showcasing data-driven decision making
Financial Data Display in Digital Grid Design
Digital Financial Statistics and Analytics Visualization with Graphs
Dynamic Stock Market Graphs with Trends and Data Alerts
Premium
Businessmen teamwork meeting to discuss the investment.
Dynamic Financial Stock Market Analysis Display
Digital Financial Data Analysis on Abstract Blue Background
Holographic Financial Data Visualization with Stock Trends
Financial Data Processing Visualization on Dark Background
Premium
Strategic financial discussion between business partners, analyzing investment data and planning future growth in a corporate environment
Digital Grid Interface with Data Points for Business Analysis
Dynamic Digital Display of Financial Data
Analytics Dashboard with Dynamic Financial Graphs and Data
Dynamic Forex Market Chart with Multiple Currencies and Growth Trends
Dark Analytics Dashboard Displaying Financial Charts, Metrics and Neon Interface
Stock Market Analysis and Data Processing Graphic
Dynamic Data Visualization Depicting Financial Growth Trends
Dynamic Data Visualization with Fluctuating Trendline and Indicators
Abstract Financial Data Charts and Graphs on Black Background
Graph Showing Stock Market Activity and Financial Data Analysis
Financial Data Analysis with Digital Graph Overlay
Visionary Financial Data Analysis on Digital Interface
Financial Data Chart Over City Silhouette
Cybersecurity Data Terminal Interface with Code and Charts
Financial Graph Showing Indices Trends on Blue Background
Social Media Engagement on Analytical Dashboard Display
Premium
Using tablet pc, Consultant between bookkeepers and accounting lawyer consultation about asset, balance sheet, stock market statistics and yearly tax law, protect business from bribery.
Abstract Graphic Business Data Visualization
Digital Data Processing with Technology Interface on Blue Background
Dynamic Financial Data on Dark Background With Colorful Graphs
Premium
Representation of data analytics,charts, graphs and data driven insights emerging from a sea of information
Dynamic Financial Graphs Illustrating Business Growth
Financial Data Visualization with Dynamic Graphs and Charts
Digital Financial Dashboard with Cyan Bar and Red Line Graph
Abstract Digital Stock Market Analysis with Graphs
Premium
Close-up of a digital display showing various charts and graphs in blue and orange hues, representing data analysis and business intelligence, ideal for technology or financial concepts
Financial Data Analysis with Graphs and Charts on Dark Background
Digital Candlestick Chart with Percentages and Analytics Lines
Financial Data Charts & Analysis on Dark Screen
Displaying financial market trends with blue and red line charts, dotted histogram columns and perce
Premium
Abstract glowing big data forex candlestick chart on blurry city backdrop. Trade, technology, investment and analysis concept
Digital Data Analytics with Financial Graphs and Indigo Background
Colorful Bar Graph with Digital Financial Data Analysis Display
Colorful Candlestick Chart on Trading Interface
Dynamic Global Financial Data with Multicolored Graph Lines
Premium
Business finance data analytics graph.Financial management technology.Advisor using KPI Dashboard on virtual screen.
Premium
Stock market graph with blue technology background, financial trading analysis chart, investment growth data visualization, economic business concept
Digital Financial Data Analysis on Dark Background
Digital Financial Chart and Global Currency Symbols on Blue Background
Futuristic Digital Dashboard Interface with Analytics Graphics
Explore More Free Stock Images