
- Home >
- Stock Photos >
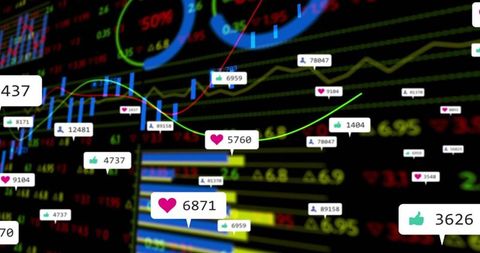
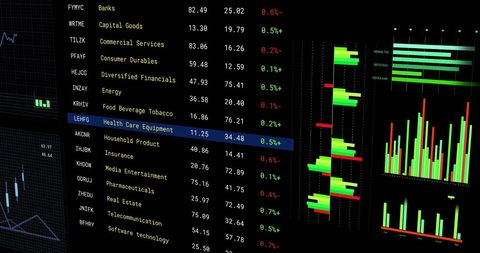
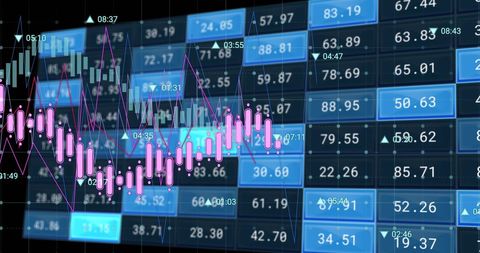
- Digital Financial Data Processing and Analysis
Digital Financial Data Processing and Analysis Image
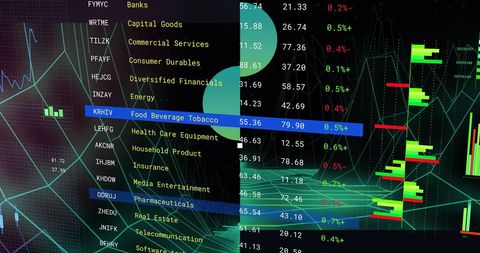
This visually striking image presents a combination of financial data with a digital background, symbolizing the complexities of global finance and continuous data processing. Suitable for use in articles about financial technology, digital transformations in finance, or presenting data analysis concepts.
Powered by  - Get 15% off with code: PIKWIZARD15


downloads
Tags:
More
Credit Photo
If you would like to credit the Photo, here are some ways you can do so
Text Link
photo Link
<span class="text-link">
<span>
<a target="_blank" href=https://pikwizard.com/photo/digital-financial-data-processing-and-analysis/038605ee6bf0f5059e335186557a10e6/>PikWizard</a>
</span>
</span>
<span class="image-link">
<span
style="margin: 0 0 20px 0; display: inline-block; vertical-align: middle; width: 100%;"
>
<a
target="_blank"
href="https://pikwizard.com/photo/digital-financial-data-processing-and-analysis/038605ee6bf0f5059e335186557a10e6/"
style="text-decoration: none; font-size: 10px; margin: 0;"
>
<img src="https://pikwizard.com/pw/medium/038605ee6bf0f5059e335186557a10e6.jpg" style="margin: 0; width: 100%;" alt="" />
<p style="font-size: 12px; margin: 0;">PikWizard</p>
</a>
</span>
</span>
Free (free of charge)
Free for personal and commercial use.
Author: Awesome Content
Similar Free Stock Images

Premium


Premium


Premium


Premium


Premium


Premium


Premium


Premium


Premium


Premium

Premium


Premium


Premium


Premium


Premium

Premium


Premium


Premium


Premium


Premium


Premium


Premium


Premium

Premium


Premium


Explore More Free Stock Images