
- Home >
- Stock Photos >
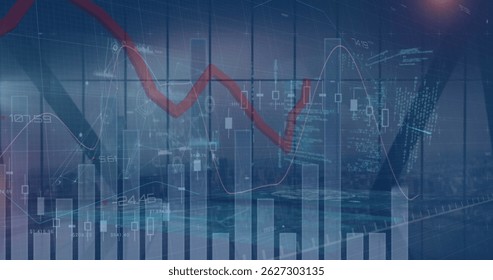
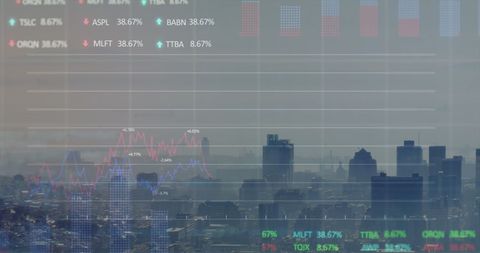
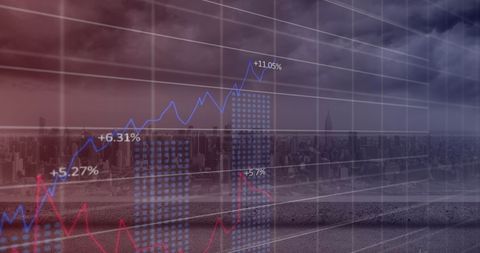
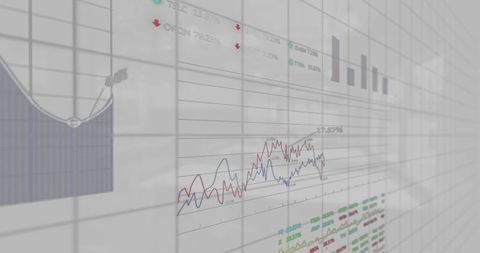
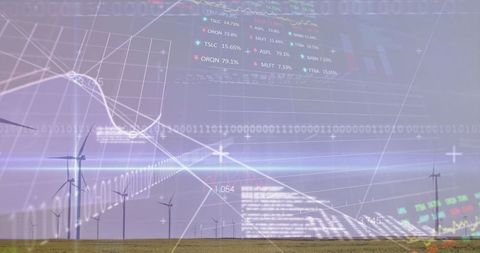
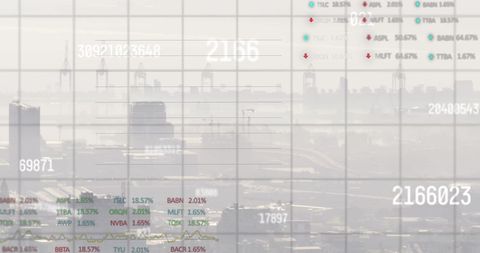
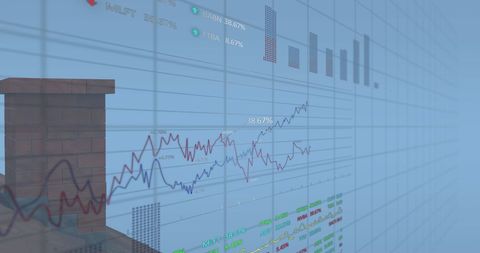
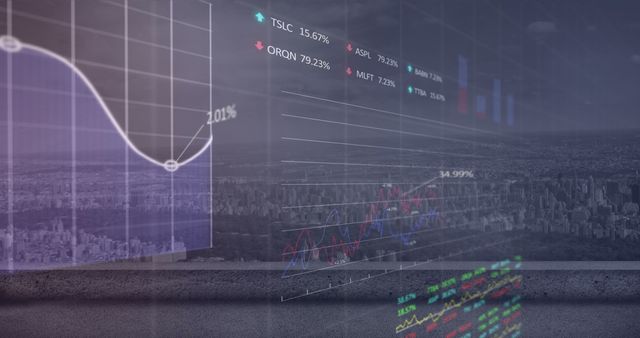
- Digital Financial Data Processing and Global Statistics Visualization
Digital Financial Data Processing and Global Statistics Visualization Image

A futuristic visualization showcasing complex financial data and global statistics over a light background. Useful for presentations on finance, economics, data analytics, and technological advancements in financial markets. Ideal for illustrating topics related to big data, market analysis, and economic trends.
Powered by  - Get 15% off with code: PIKWIZARD15


downloads
Tags:
More
Credit Photo
If you would like to credit the Photo, here are some ways you can do so
Text Link
photo Link
<span class="text-link">
<span>
<a target="_blank" href=https://pikwizard.com/photo/digital-financial-data-processing-and-global-statistics-visualization/d0f7b4dbefd35c8480abfd5999bd8af1/>PikWizard</a>
</span>
</span>
<span class="image-link">
<span
style="margin: 0 0 20px 0; display: inline-block; vertical-align: middle; width: 100%;"
>
<a
target="_blank"
href="https://pikwizard.com/photo/digital-financial-data-processing-and-global-statistics-visualization/d0f7b4dbefd35c8480abfd5999bd8af1/"
style="text-decoration: none; font-size: 10px; margin: 0;"
>
<img src="https://pikwizard.com/pw/medium/d0f7b4dbefd35c8480abfd5999bd8af1.jpg" style="margin: 0; width: 100%;" alt="" />
<p style="font-size: 12px; margin: 0;">PikWizard</p>
</a>
</span>
</span>
Free (free of charge)
Free for personal and commercial use.
Author: People Creations
Similar Free Stock Images

Premium


Premium

Premium


Premium


Premium


Premium


Premium


Premium


Premium

Premium

Premium

Premium


Premium


Premium


Premium


Premium


Premium


Premium


Premium


Premium


Premium
Premium


Premium


Premium


Premium


Explore More Free Stock Images