
- Home >
- Stock Photos >
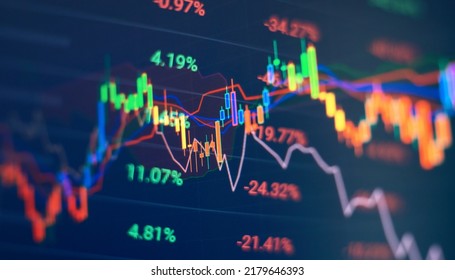
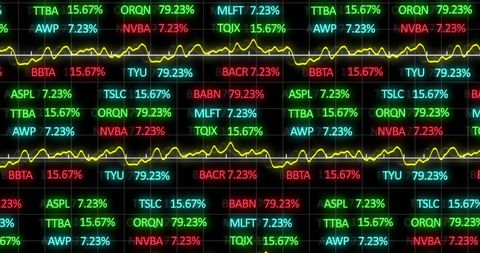
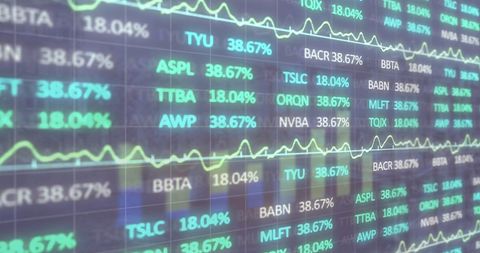
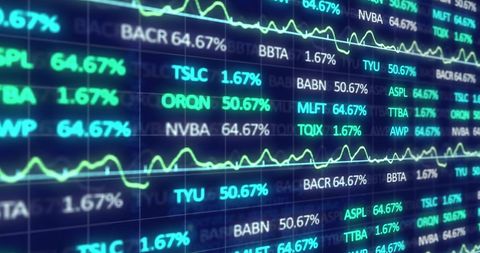
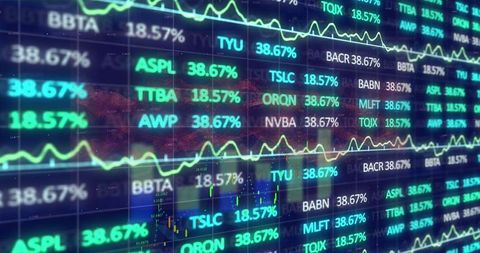
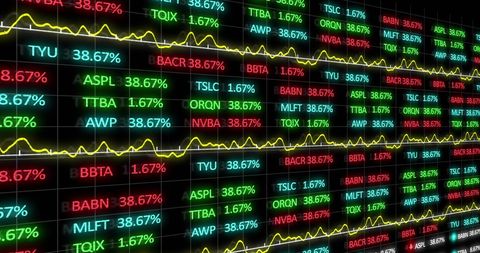
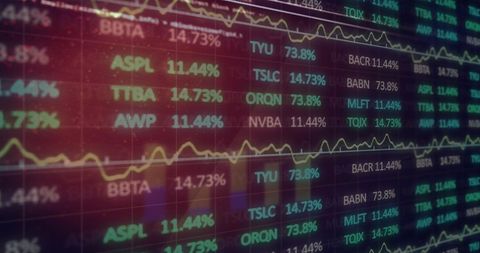
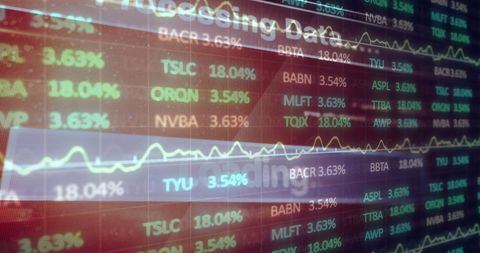
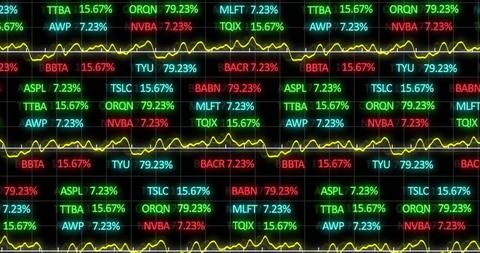
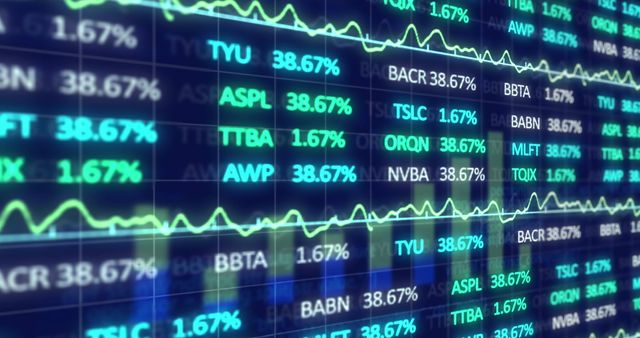
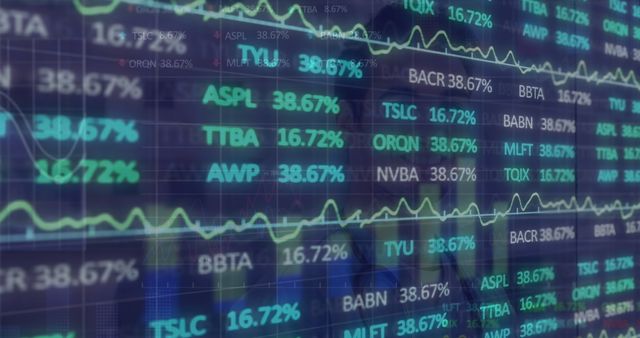
- Digital Financial Data Processing and Stock Market Analysis Visualization
Digital Financial Data Processing and Stock Market Analysis Visualization Image
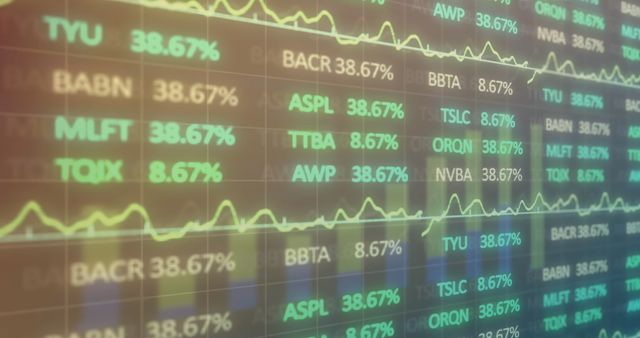
This image shows financial data visualizing fluctuations in the stock market, emphasizing analytical insights and economic patterns. Ideal for using in finance-related content, investment brochures, stock market analysis discussions, economy news outlets, business presentations, or educational materials on financial literacy and data analytics.
Powered by  - Get 15% off with code: PIKWIZARD15


downloads
Tags:
More
Credit Photo
If you would like to credit the Photo, here are some ways you can do so
Text Link
photo Link
<span class="text-link">
<span>
<a target="_blank" href=https://pikwizard.com/photo/digital-financial-data-processing-and-stock-market-analysis-visualization/8adfae9b658340465ec954dc1538b3e7/>PikWizard</a>
</span>
</span>
<span class="image-link">
<span
style="margin: 0 0 20px 0; display: inline-block; vertical-align: middle; width: 100%;"
>
<a
target="_blank"
href="https://pikwizard.com/photo/digital-financial-data-processing-and-stock-market-analysis-visualization/8adfae9b658340465ec954dc1538b3e7/"
style="text-decoration: none; font-size: 10px; margin: 0;"
>
<img src="https://pikwizard.com/pw/medium/8adfae9b658340465ec954dc1538b3e7.jpg" style="margin: 0; width: 100%;" alt="" />
<p style="font-size: 12px; margin: 0;">PikWizard</p>
</a>
</span>
</span>
Free (free of charge)
Free for personal and commercial use.
Author: Awesome Content
Similar Free Stock Images
Premium


Premium
Premium


Premium


Premium

Premium


Premium


Premium


Premium


Premium


Premium


Premium

Premium

Premium


Premium


Premium


Premium

Premium


Premium

Premium


Premium

Premium


Premium


Premium

Premium

Explore More Free Stock Images