1. Home > 
  2. Stock Photos > 
  3. Digital Financial Data Processing Display with Global Trends

Digital Financial Data Processing Display with Global Trends Image

Digital Financial Data Processing Display with Global Trends

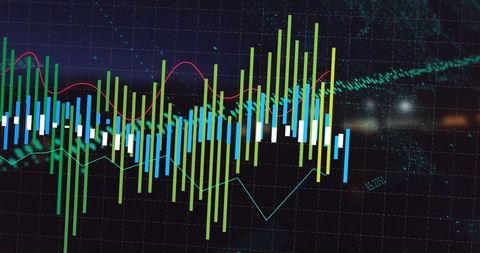
Colorful bar and line graphs against a dark digital backdrop present financial data and analysis, with emphasis on economic trends and technological advancements. Ideal for use in articles, presentations, and wallpapers related to finance, stock market strategies, and global economic forecasting.

Powered by Adobe logo
Businessman and broker analyzing profit of investment and stock market growth performance forecast and financial growth of business, Investor and stock exchange trading. - Powered by AdobeDynamic digital financial graph with glowing purple and blue trend lines on dark background displaying market analytics data for investment technology - Powered by Adobe
Dynamic blue and green digital stock market graph with bar charts and lines on a dark background, representing financial data analysis, investment trends, business growth, and global economy fluctuat - Powered by AdobeHand interacting with financial stock market trading candlestick charts analyzing growth opportunities and investment strategies - Powered by AdobeFinancial data graph with rising and falling trends in vibrant colors - Powered by Adobe

Credit Photo

If you would like to credit the Photo, here are some ways you can do so

Free (free of charge)

Free for personal and commercial use.

Author: Creative Art

Similar Free Stock Images

Data Visualization on Security Shield Interface for Cyber Security
Premium
stock market trend chart
Dynamic Financial Data on Digital Screen
Abstract Financial Graph Illustration on Dark Background
Premium
Financial market analysis with stock graph overlay and industrial skyline at dusk
Global Data Analytics Over World Map with Numeric Statistics
Financial Chart Analysis with Digital Grid Interface
Financial Data Overlay on Cityscape Visualizing Market Trends
Digital Graph with Rising and Falling Lines on Grid Background
Premium
Dynamic glowing green stock market graph ascends, symbolizing financial growth and positive economic trends with bokeh lights.
Glowing Data Lines on Financial Graph Grid Background
Abstract Financial Graph On Black Background Representing Data Analysis
Dynamic Data Graphs on Digital Interface Background
Dynamic Financial Data Displays Stock Market Trends
Premium
Abstract representation of financial growth with glowing graphs and data patterns in dark background
Dynamic Financial Data Visualizations on Grid Interface
Digital Finance Chart Overlaying Globe Background
Financial Graph Analysis on Green Grid Background
Rising Stock Market Graph on Blue Financial Background
Premium
real estate investing concept with digital stock market candlestick on business skyscrapers background double exposure no logos no brands ar 169
Abstract Financial Data Charts Reflecting Economic Trends
Futuristic Graph with Digital Globe Symbolizing Global Technology Connections
Falling Line Graph on Navy Background Illustrating Economic Decline
Analyzing Stock Market Trends with Dynamic Graphs and Data
Abstract Financial Data Visualization in Server Room
Abstract Financial Graph with Bar and Line Charts on Dark Background
Global Stock Market Data Visualization on Digital Map Background
Line Graph Illustrating Data Trend on Green Digital Background
Premium
Blue stock market graph background with glowing lines and candlestick chart, financial data or business growth
Financial Growth Stock Nikkei in Urban City Skyline
Abstract Graphs Over Modern Building at Night
Abstract Digital Blue Dot Graph with Floating Numbers
Dynamic Financial Graph in Virtual Red Grid Background
Tech Growth Analysis with Dynamic Data Visualization
Digital Financial Data Analytics and Trend Graphs
Dynamic Financial Graphs Overlaying Modern Cityscape
Rising Financial Data Graph on Digital Grid Background
Dynamic Stock Market Graph Displaying Surging Growth
Cityscape with Digital Stock Market Graphs and Statistics
Futuristic Financial Graph with Data Overlays in Blue Holographic Style
Abstract Digital Data Graph and Diagrams on Gray Background
Digital Data Processing with Graph and Grid Technology Interface
Premium
Business, finance and investment concept. Business man analyzing and calculating tax, interest rate, financial data with economic graph growth chart, strategy and budget planning.
Premium
Businessman interacting with digital forex and stock market chart interface showing buy and sell decisions with futuristic holographic data overlay.
Abstract Digital Data Network with Graphs and Symbols
Data Visualization with Rising Red Arrow and Floating Numbers
Financial Data Analysis with Declining Trends
Financial Stock Market Data Visualization with Declining Trends
Data Trends and Analysis on 3D Digital Grid
Data Analysis Graphics on Digital Grid Background
Digital Simulated Global Financial Data and Graphs
Dynamic Financial Graphs Overlaying Urban Skyline
Premium
Colorful digital screen with glowing forex and stock market candlestick chart and data analysis on dark interface background for modern financial display. 3D Rendering
Premium
Abstract green arrow chart going upward, data analysis concept for financial growth, investment strategies and market success
Colorful Data Visualization on Dark Background
Abstract Digital Graphs Showing Financial Data Analysis
Abstract Digital Finance Chart Showing Fluctuating Graph Lines
Premium
Upward trending financial graph with rising stock market bars and arrow
Premium
Stock market investment trading graph growth.Investment finance chart,stock market business and exchange financial growth graph.
Digital Data Network with Dynamic Connections
Abstract Representation of Financial Data Processing
Graph Lines Portraying Financial Data Trends
Digital Financial Data with Graph and Grid Patterns
Financial Data Analysis Vibrant Graphs on Blue Background
Premium
Transparent or png stock market investment trading graph growth.Trade business analytics graph and financial chart.
Premium
Abstract financial stock market graph with candlestick bars isolated on transparent background
Digital Financial Data Graph Showcasing Market Trends
Dynamic Stock Market Data on Digital Interface
Premium
Dynamic financial chart overlaying stunning cityscape at night, symbolizing growth and opportunity in the modern business world with vibrant colors
Financial Graph Displayed Over City Skyline at Sunset
Dynamic Financial Chart with Upward Growth Arrow
Futuristic Digital Data Analytics Interface Display
Data Analytics and Financial Growth Indicators
Financial Data Graph Rendering Global Market Trends
Financial Data Analysis with Futuristic Technology Interface
Financial Data Processing Visualization with Colorful Bar Charts
Dynamic Stock Market Graphs Over Digital Interface
NFT Financial Data Visualization with Digital Graph Overlay
Premium
Business growth and investment concept with upward arrow, financial data charts, profit and market strategy visualization on dark blue circuit technology background
Premium
Red downward trending stock market graph with candlestick chart showing financial decline and economic recession
Abstract Data Visualization with Dynamic Charts and Graphs
Global Financial Data Processing with Abstract Graphs
European Market Data Overlay with EU Flag and Financial Graphs
Abstract Digital Data Visualization on Black Background
Digital Financial Data Processing with Glowing Indicators
Dynamic Financial Chart with Data Points on Red Grid Background
Economic and Political Factors Influence Investment Trends
Digital Interface Showing Global Business Data Analytics
Digital Graph Displaying Dynamic Data Analysis
Futuristic Digital Graph Showing Data Trends on Analytic Interface
Dynamic Digital Financial Data Chart Visualization
Digital Stock Market Graph Red Trendline on Green Background
Abstract Financial Graph with Glowing Node on Grid Background
Premium
Abstract digital green graph shows strong market growth. Yellow arrow moves upwards, reflecting increasing stock value, rising business profits. Data visualization indicates economic development,
Digital Financial Data on Server with Stock Market Graph
Neon AI Data Visualization Dashboard Displaying Neural-Tree Line Chart with Nodes
Dynamic Stock Market Graphs and Financial Data
Financial Data Graphics Over World Map in Digital Style
Data Analytics Graphs on Digital Interface Background
Dynamic Financial Data Chart Showing Trend Analysis
Futuristic Global Finance Chart with Rotating Globe Animation
Premium
AI finance business data analysis digital technology investment trading market stock, financial analyst using advanced holographic interface for global market insight, smart investment strategy
Premium
Financial data graph displaying stock market trends in a digital city
Futuristic Data Analytics Over Technical Blueprint Design
Analyzing Financial Data on Digital World Map Background
Digital Graph Representing Data Analysis and Technology
Financial Data Analysis with Dynamic Graph on Blue Background
Premium
Abstract image depicting financial data overlaid on a blurred cityscape background, suggesting the dynamism of urban markets and global finance
Abstract Financial Graph with Rising Waves on Red Gradient
Global Networking Concept with 6G Technology Display
Financial Data Processing with Green Digital Graph in Action
Financial Data with Molecular Background Concept
Premium
Futuristic digital visualization of financial growth and stock market analysis, depicting big data flow across a technology network
Data Visualization of Financial Market with Dots and Lines
Real-Time Financial Data Analysis with Graphs and Charts
Colorful Bar Graph on Dark Background Illustrates Data Trends
Digital Financial Data Overlaying City Skyline at Dusk
Premium
Businessman working with modern computer virtual dashboard analyzing finance sales data and economic growth graph chart and block chain technology.
Premium
Data analyzing and stock market visualization with digital charts, financial dashboards, and performance metrics. Ideal for investment analysis, trading strategy, and economic forecasting.
Digital Sound Wave with Frequency Bars on Dark Blue Background
Abstract Technology Chart with Blue Dots on Black Background
Dynamic Stagflation Concept Displaying Economic Burdens
Dynamic Financial Data Graph on Blue Digital Background
Premium
Hand interacting with financial data on a digital screen showing stock market graphs
Digital Graphs and Data Visualization on Green Background
Explore More Free Stock Images