
- Home >
- Stock Photos >
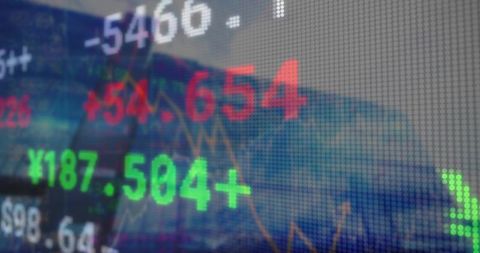
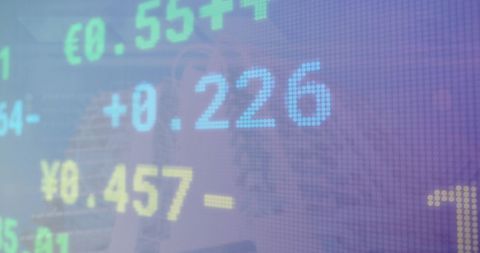
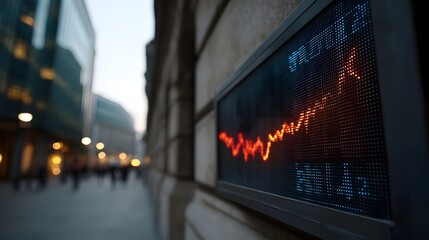
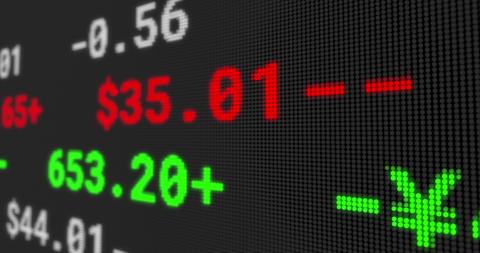
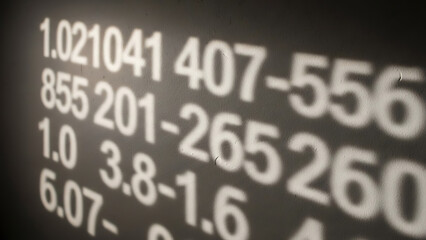
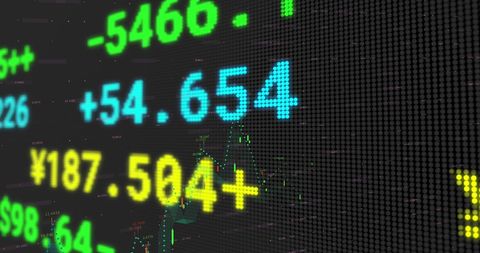
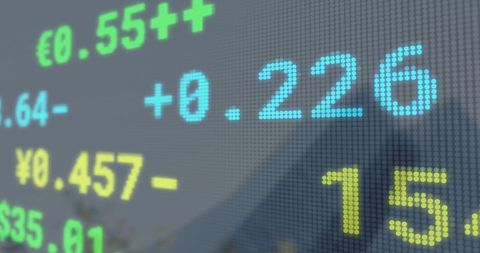
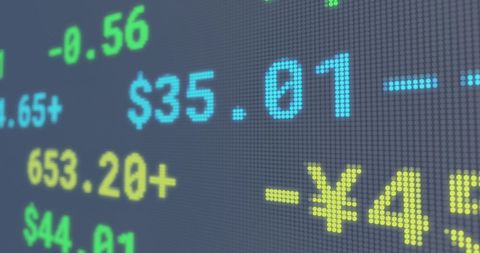
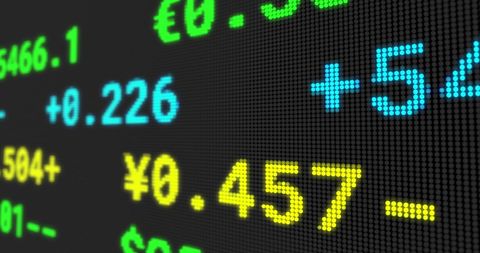
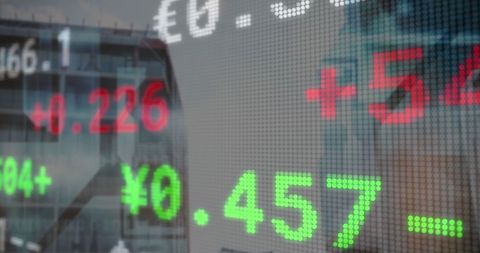
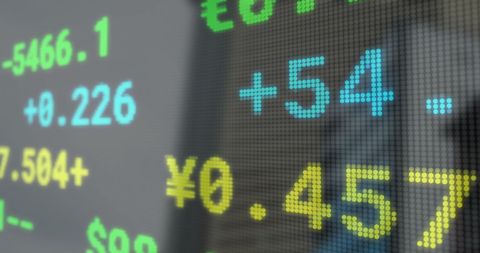
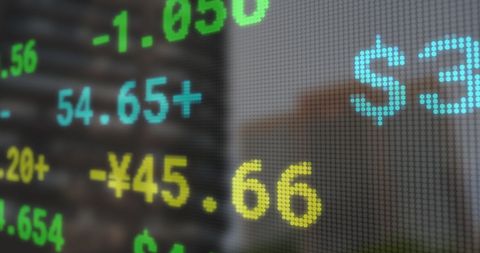
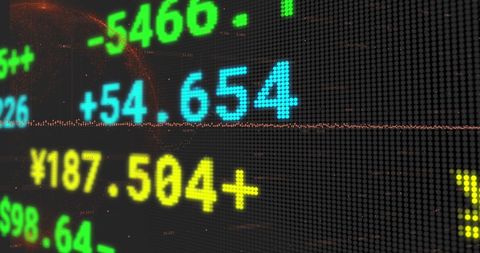
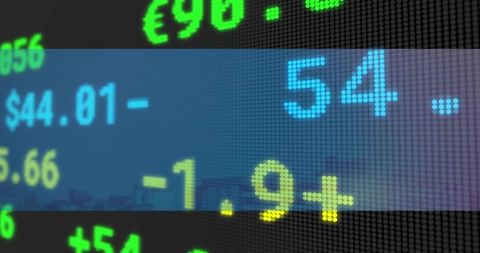
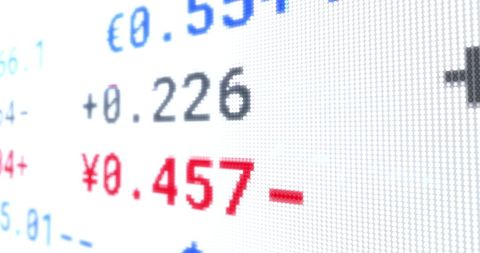
- Digital Financial Data Processing Display with Graphs
Digital Financial Data Processing Display with Graphs Image
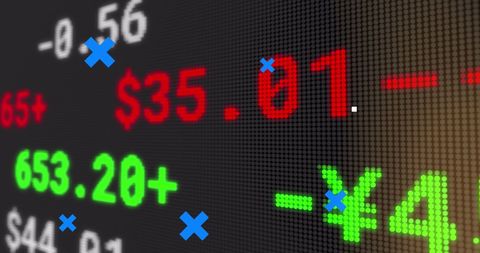
The image showcases a digital display of financial data, featuring fluctuating numbers that indicate stock prices and exchange rates. Blurs and blue crosses are artistically overlaid. Useful for illustrating topics related to financial markets, technology's impact on trading, and data analytics in finance. Relevant for articles on stock market behavior or financial data interpretation.
Powered by 


downloads
Tags:
More
Credit Photo
If you would like to credit the Photo, here are some ways you can do so
Text Link
photo Link
<span class="text-link">
<span>
<a target="_blank" href=https://pikwizard.com/photo/digital-financial-data-processing-display-with-graphs/23a36f48fb368414e1b3b0a0cc8e98d5/>PikWizard</a>
</span>
</span>
<span class="image-link">
<span
style="margin: 0 0 20px 0; display: inline-block; vertical-align: middle; width: 100%;"
>
<a
target="_blank"
href="https://pikwizard.com/photo/digital-financial-data-processing-display-with-graphs/23a36f48fb368414e1b3b0a0cc8e98d5/"
style="text-decoration: none; font-size: 10px; margin: 0;"
>
<img src="https://pikwizard.com/pw/medium/23a36f48fb368414e1b3b0a0cc8e98d5.jpg" style="margin: 0; width: 100%;" alt="" />
<p style="font-size: 12px; margin: 0;">PikWizard</p>
</a>
</span>
</span>
Free (free of charge)
Free for personal and commercial use.
Author: Creative Art
Similar Free Stock Images
Premium

Premium

Premium


Premium


Premium

Premium


Premium


Premium


Premium


Premium

Premium


Premium


Premium


Premium


Premium


Premium


Premium


Premium


Premium


Premium

Premium


Premium


Premium
Premium

Premium


Explore More Free Stock Images