
- Home >
- Stock Photos >
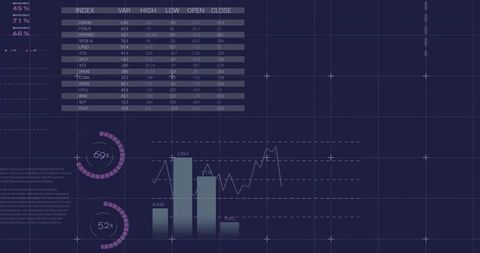
- Digital Financial Data Processing Displayed on Blue Background
Digital Financial Data Processing Displayed on Blue Background Image

Illustration of financial data processing against blue backdrop, merging traditional financial metrics with digital analytics. Ideal for topics linked to technological advancements in finance, modern data analysis methods, or global economic trends. Suitable for presentations on financial technology innovations, educational materials discussing economic contexts, or articles focused on strategic business analytics.
Powered by 


downloads
Tags:
More
Credit Photo
If you would like to credit the Photo, here are some ways you can do so
Text Link
photo Link
<span class="text-link">
<span>
<a target="_blank" href=https://pikwizard.com/photo/digital-financial-data-processing-displayed-on-blue-background/fb1d68e69b2dd593e98f38bf473e351f/>PikWizard</a>
</span>
</span>
<span class="image-link">
<span
style="margin: 0 0 20px 0; display: inline-block; vertical-align: middle; width: 100%;"
>
<a
target="_blank"
href="https://pikwizard.com/photo/digital-financial-data-processing-displayed-on-blue-background/fb1d68e69b2dd593e98f38bf473e351f/"
style="text-decoration: none; font-size: 10px; margin: 0;"
>
<img src="https://pikwizard.com/pw/medium/fb1d68e69b2dd593e98f38bf473e351f.jpg" style="margin: 0; width: 100%;" alt="" />
<p style="font-size: 12px; margin: 0;">PikWizard</p>
</a>
</span>
</span>
Free (free of charge)
Free for personal and commercial use.
Author: Authentic Images
Similar Free Stock Images

Premium


Premium

Premium


Premium


Premium


Premium


Premium

Premium


Premium


Premium


Premium


Premium


Premium


Premium


Premium

Premium


Premium


Premium

Premium


Premium


Premium


Premium


Premium

Premium


Premium


Explore More Free Stock Images