- Home >
- Stock Photos >
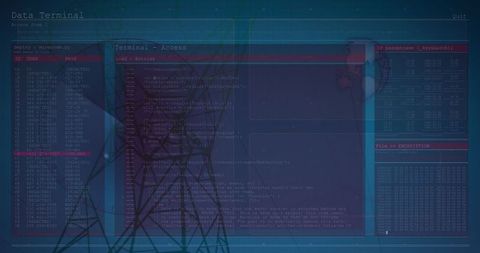
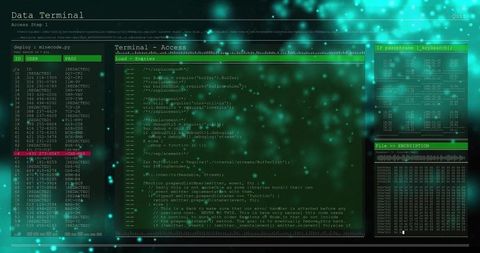
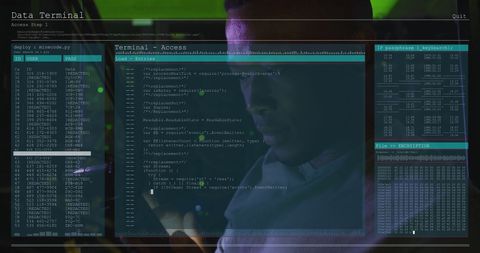
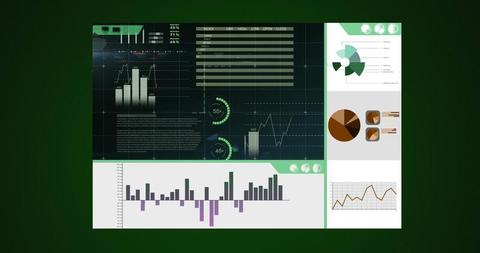
- Digital Financial Data Processing Interface with Graphs and Codes
Digital Financial Data Processing Interface with Graphs and Codes Image

This representation of a computer interface showcases financial data processing aspects including graphs, code, and encryption workflows. Suitable for illustrating themes surrounding financial technology, cybersecurity, data analysis, and global economic systems, this concept visual can be utilized in articles, presentations, and software training materials about digital transformations at financial institutions or data security challenges.

downloads
Tags:
More
Credit Photo
If you would like to credit the Photo, here are some ways you can do so
Text Link
photo Link
<span class="text-link">
<span>
<a target="_blank" href=https://pikwizard.com/photo/digital-financial-data-processing-interface-with-graphs-and-codes/6ffb21f2fd45472baa9080ce4bc2402e/>PikWizard</a>
</span>
</span>
<span class="image-link">
<span
style="margin: 0 0 20px 0; display: inline-block; vertical-align: middle; width: 100%;"
>
<a
target="_blank"
href="https://pikwizard.com/photo/digital-financial-data-processing-interface-with-graphs-and-codes/6ffb21f2fd45472baa9080ce4bc2402e/"
style="text-decoration: none; font-size: 10px; margin: 0;"
>
<img src="https://pikwizard.com/pw/medium/6ffb21f2fd45472baa9080ce4bc2402e.jpg" style="margin: 0; width: 100%;" alt="" />
<p style="font-size: 12px; margin: 0;">PikWizard</p>
</a>
</span>
</span>
Free (free of charge)
Free for personal and commercial use.
Author: Authentic Images