
- Home >
- Stock Photos >
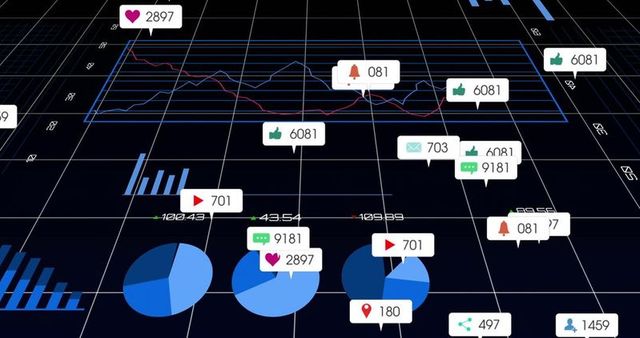
- Digital Financial Data Processing on Abstract Grid Background
Digital Financial Data Processing on Abstract Grid Background Image

Stylized representation of digital data and financial graphs, set against an abstract grid. Ideal for illustrating technology-driven solutions for finance, economic analysis, or data science presentations. Suitable for use in blogs, presentations, or advertisements related to financial institutions and technological advancements.
Powered by 


downloads
Tags:
More
Credit Photo
If you would like to credit the Photo, here are some ways you can do so
Text Link
photo Link
<span class="text-link">
<span>
<a target="_blank" href=https://pikwizard.com/photo/digital-financial-data-processing-on-abstract-grid-background/e98384f4f775d21b9f6fce7bfc3ae329/>PikWizard</a>
</span>
</span>
<span class="image-link">
<span
style="margin: 0 0 20px 0; display: inline-block; vertical-align: middle; width: 100%;"
>
<a
target="_blank"
href="https://pikwizard.com/photo/digital-financial-data-processing-on-abstract-grid-background/e98384f4f775d21b9f6fce7bfc3ae329/"
style="text-decoration: none; font-size: 10px; margin: 0;"
>
<img src="https://pikwizard.com/pw/medium/e98384f4f775d21b9f6fce7bfc3ae329.jpg" style="margin: 0; width: 100%;" alt="" />
<p style="font-size: 12px; margin: 0;">PikWizard</p>
</a>
</span>
</span>
Free (free of charge)
Free for personal and commercial use.
Author: Awesome Content
Similar Free Stock Images
Premium


Premium

Premium


Premium


Premium


Premium


Premium


Premium


Premium


Premium


Premium


Premium


Premium


Premium


Premium


Premium


Premium


Premium


Premium


Premium


Premium


Premium


Premium


Premium


Premium

Explore More Free Stock Images