- Home >
- Stock Photos >
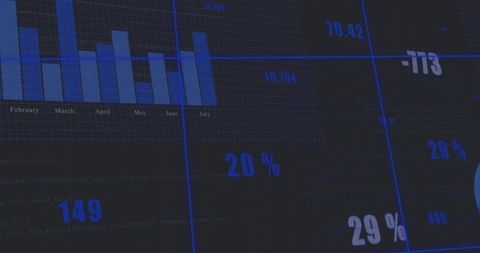
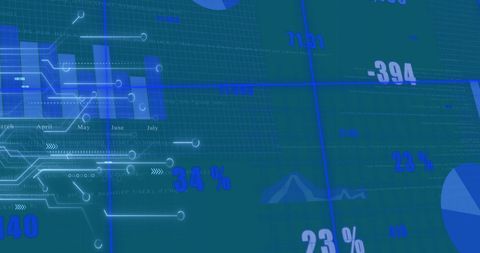
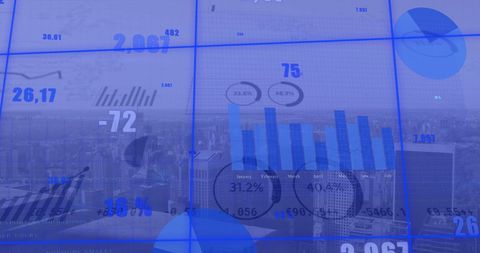
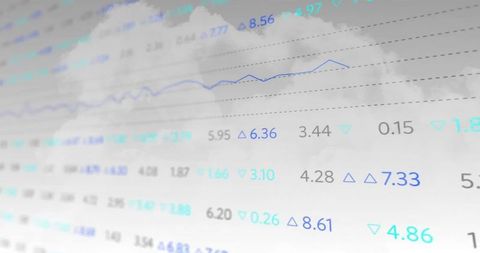
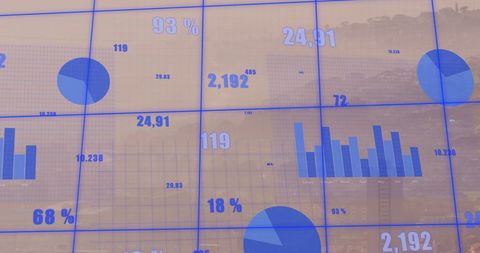
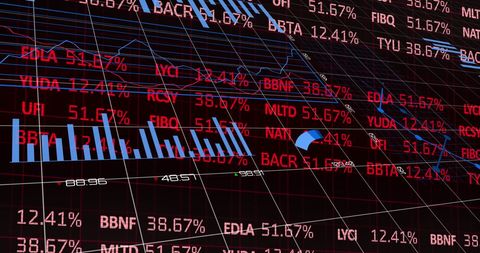
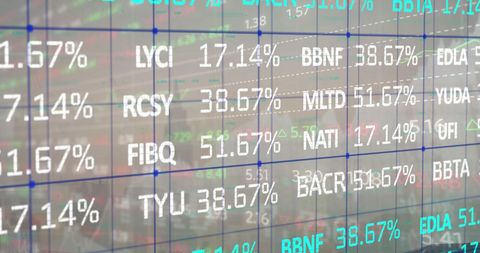
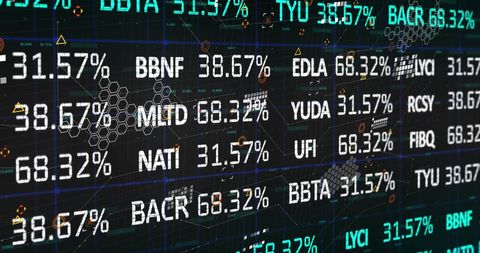
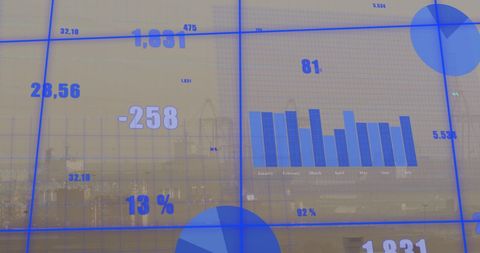
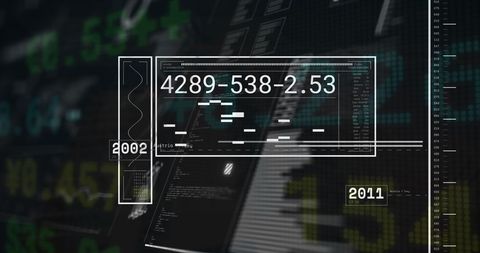
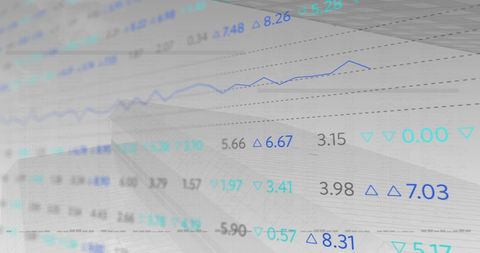
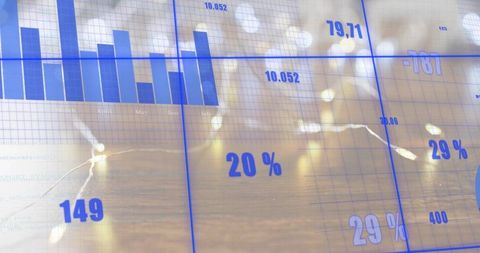
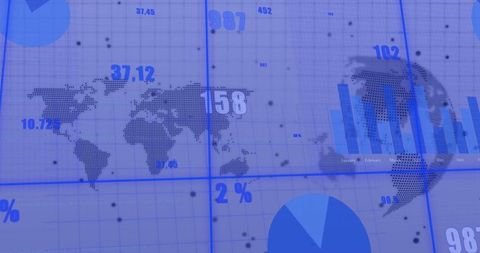
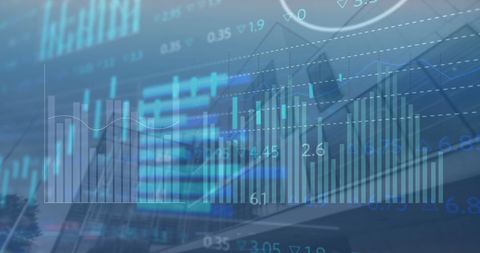
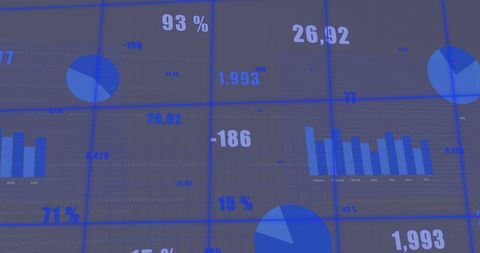
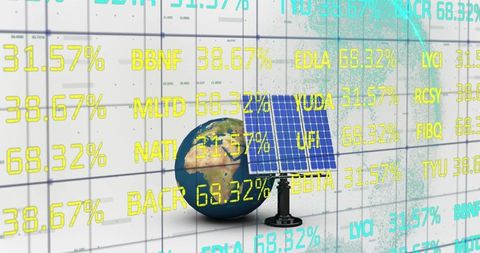
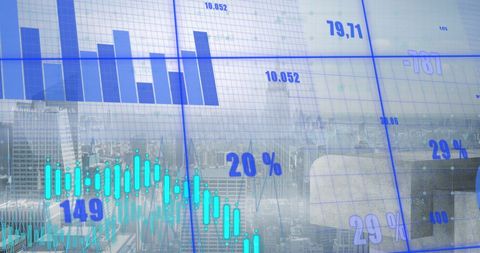
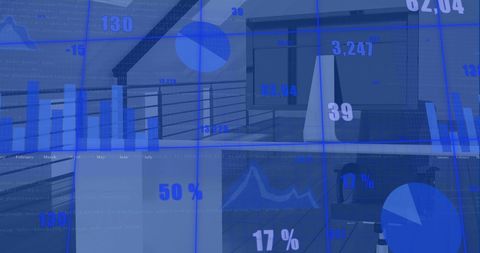
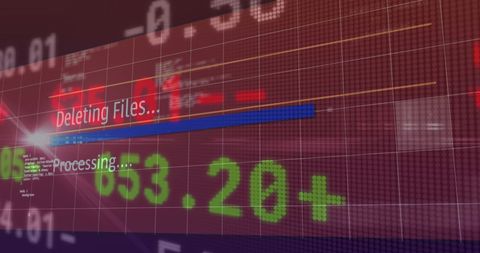
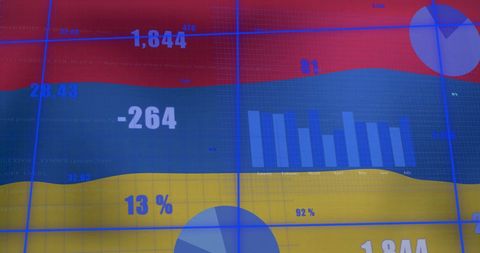
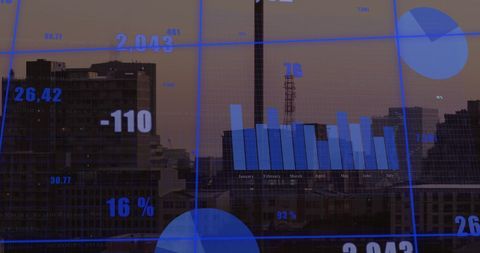
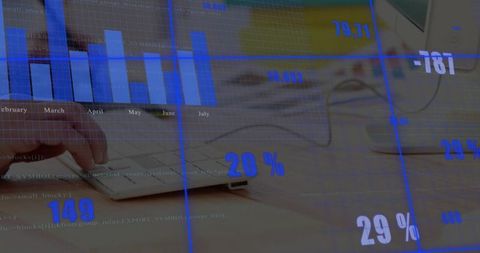
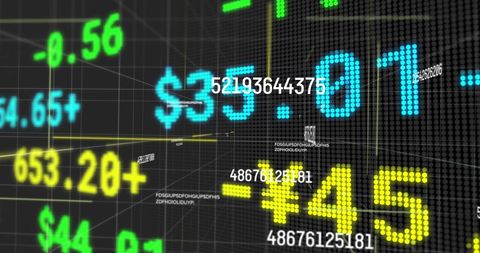
- Digital Financial Data Processing on Dark Background
Digital Financial Data Processing on Dark Background Image

Visual representation of financial data and charts emerging from a dark background. This image displays digital graphs and numerical figures, often used in financial analysis presentations, tech seminars, and corporate settings to emphasize modern data management and global finance trends.

downloads
Tags:
More
Credit Photo
If you would like to credit the Photo, here are some ways you can do so
Text Link
photo Link
<span class="text-link">
<span>
<a target="_blank" href=https://pikwizard.com/photo/digital-financial-data-processing-on-dark-background/80541e396506cb44dfae511e29bab0a8/>PikWizard</a>
</span>
</span>
<span class="image-link">
<span
style="margin: 0 0 20px 0; display: inline-block; vertical-align: middle; width: 100%;"
>
<a
target="_blank"
href="https://pikwizard.com/photo/digital-financial-data-processing-on-dark-background/80541e396506cb44dfae511e29bab0a8/"
style="text-decoration: none; font-size: 10px; margin: 0;"
>
<img src="https://pikwizard.com/pw/medium/80541e396506cb44dfae511e29bab0a8.jpg" style="margin: 0; width: 100%;" alt="" />
<p style="font-size: 12px; margin: 0;">PikWizard</p>
</a>
</span>
</span>
Free (free of charge)
Free for personal and commercial use.
Author: Creative Art