- Home >
- Stock Photos >
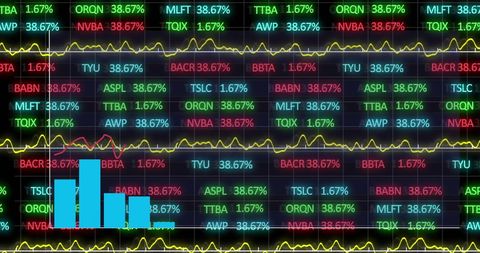
- Digital Financial Data Processing on Dark Interface
Digital Financial Data Processing on Dark Interface Image
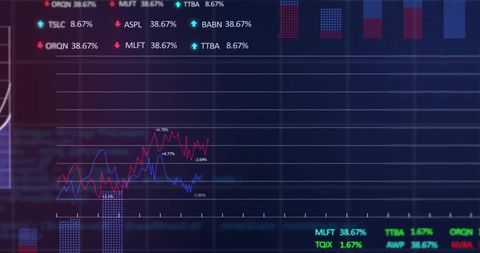
Abstract representation of financial data analysis with graphs and numeric percentages illuminating on a dark background. Suitable for illustrating themes related to stock market trends, data processing, and modern financial systems. Can be used in business presentations, technology blogs, or educational materials focused on finance and data analytics.

downloads
Tags:
More
Credit Photo
If you would like to credit the Photo, here are some ways you can do so
Text Link
photo Link
<span class="text-link">
<span>
<a target="_blank" href=https://pikwizard.com/photo/digital-financial-data-processing-on-dark-interface/71f9d1258dc7ec84bb591485510b3f6b/>PikWizard</a>
</span>
</span>
<span class="image-link">
<span
style="margin: 0 0 20px 0; display: inline-block; vertical-align: middle; width: 100%;"
>
<a
target="_blank"
href="https://pikwizard.com/photo/digital-financial-data-processing-on-dark-interface/71f9d1258dc7ec84bb591485510b3f6b/"
style="text-decoration: none; font-size: 10px; margin: 0;"
>
<img src="https://pikwizard.com/pw/medium/71f9d1258dc7ec84bb591485510b3f6b.jpg" style="margin: 0; width: 100%;" alt="" />
<p style="font-size: 12px; margin: 0;">PikWizard</p>
</a>
</span>
</span>
Free (free of charge)
Free for personal and commercial use.
Author: Awesome Content