1. Home > 
  2. Stock Photos > 
  3. Digital Financial Data Processing on Notepad Screen

Digital Financial Data Processing on Notepad Screen Image

Digital Financial Data Processing on Notepad Screen

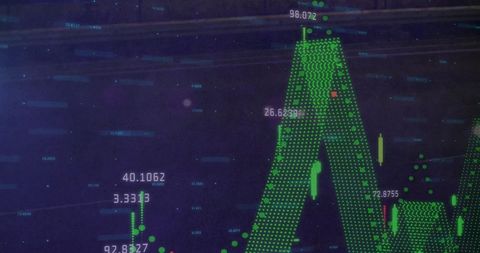
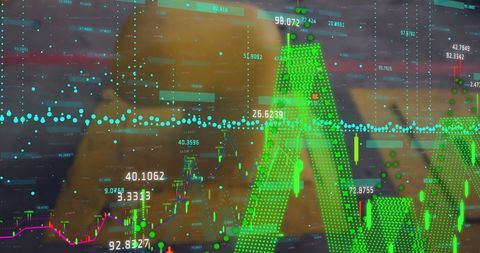
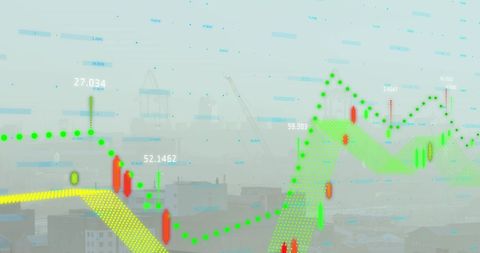
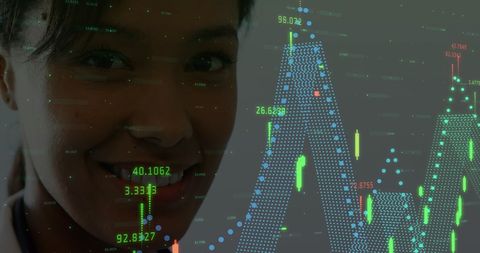
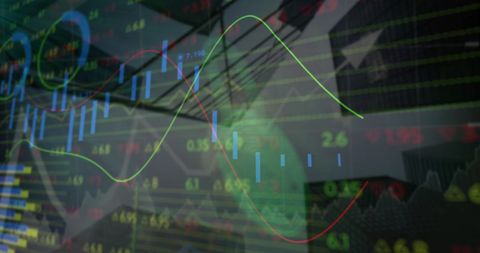
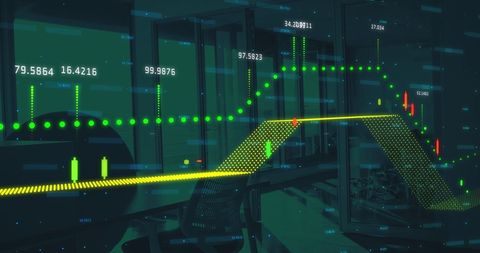
Stock chart visual overlay with financial statistics shows digital processing in modern business. Use for illustrating financial technology, market analysis, data-driven insights in global economy.

Powered by Shutterstock logo - Get 15% off with code: PIKWIZARD15
Business finance data analytics graph.Financial management technology.Advisor using KPI Dashboard on virtual screen. - Powered by Shutterstock - Get 15% off with code: PIKWIZARD15Double exposure image of coin stacks on technology financial graph background.Economy trends background for business ,financial meltdown ,Cryptocurrency digital economy. - Powered by Shutterstock - Get 15% off with code: PIKWIZARD15Big data technology and data science with person touching data flowing on virtual screen. Business analytics, artificial intelligence, machine learning. Engineer or scientist analyzing stream of data. - Powered by Shutterstock - Get 15% off with code: PIKWIZARD15Man look at the dashboard with graphs and charts. Concept of data management system, business intelligence, data statistics, marketing analysis, key performance indicators (KPI) and analytics. - Powered by Shutterstock - Get 15% off with code: PIKWIZARD15Big data technology and data science. Data scientist querying, analysing and visualizing complex set on virtual screen. Data flow concept. Neural network, artificial intelligence, ML, analytics. - Powered by Shutterstock - Get 15% off with code: PIKWIZARD15

Credit Photo

If you would like to credit the Photo, here are some ways you can do so

Free (free of charge)

Free for personal and commercial use.

Author: Creative Art

Similar Free Stock Images

Colorful Financial Graph with Global Map Display
Premium
Analyzing Key Performance Indicators. Businessman using digital screen to analyze key performance indicators (KPI) with various graphs and charts, showcasing data analysis and performance tracking.
Cybersecurity Data Analysis and Encrypted Connections
Abstract Digital Financial Analytics with Data Visualizations
Digital Financial Graphs and Data in Motion
Financial Data Security Concept with Graphs and Padlock
Premium
Businessman using tablet Analytics Data KPI Dashboard Tech with charts, metrics, and KPI to analyze performance and create insight reports for operations management.Data mining.Data analysis.Ai
Digital Data Processing with Infographic Elements
Global Financial Analysis Over Neon Cityscape
Dynamic Financial Data with Abstract Stock Market Graphs
Advanced Digital Graph Illustrating Stock Market Trends
Premium
Man Typing Keyboard Laptop Hand.Project Manager Researching Process.Business Team Working Startup modern Office.Global Strategy Virtual Icon.Innovation Graphs Interfaces.Analyze market stock.Blurred
Global Financial Data Analytics in an Empty Office
Stock Market Analysis with Digital Data Visualization
Financial Data Visualization Over Construction Site
Digital Financial Graph in Modern Office Setting
Premium
Woman hold smartphone use pc at workplace. Project stats financial data sales charts on laptop and cellphone screen, close up view over shoulder. Report preparation, synchronization for safety concept
Data Analytics Over Water Media in Modern Business
Digital Notifications and Holographic Data Visualization
Global Data Processing and Analytics on Dark Background
Abstract Financial Data Visualization on Digital Screen with World Map
Premium
Business finance data analytics graph.Financial management technology.Advisor using KPI Dashboard on virtual screen.
Futuristic Data Visualization with Rising Graphs on Orange Background
Dynamic Financial Data Processing Over Skyscrapers
Digital Financial Data Overlay on Modern Office Interior
Global Financial Data Display on World Map Background
Premium
Businessman showing result of growth company profit planning, opportunity, challenge and business strategy graphs and target of business. Banner of plan and visions for financial and economy analysis.
Team Analyzing Financial Charts in Modern Office Environment
Dynamic Financial Data with Interactive Graphs on Digital Screen
Abstract Digital Data Visualization and Analysis Background
Futuristic 3D Digital Chart with Financial Data Visualization
3D Stock Market Graph in Digital Display
Digital Financial Data Analysis with Graphs
Premium
Futuristic Digital Growth Chart – 3D Bar Graph with Glowing Blue Data Visualization
Digital Financial Data Processing Concept
Dynamic Visualization of Financial Markets on Dark Background
Dynamic Financial Data Over Futuristic Building Render
Abstract Digital Data Processing Background with Graphs
Premium
Online trading, Investment, Strategy market plan, and Stock mark
Digital Financial Visualization Overlaid on World Map at Night
Dynamic Financial Data Processed Amid City Lights at Night
Global Stock Market Graph on a Digital World Map
Global Financial Data Overlay with Vibrant Graphs on World Map
Premium
Business analysis big data screen and economic growth with financial graph. Concept of virtual dashboard technology digital marketing and global economy network connection. 3D illustration.
Digital Network Connections Visualization with Data Analysis Graphs
Financial Data Visualization Against City Skyline
Urban Construction With Digital Financial Overlay
Abstract Digital Finance and Global Economy Data Visualization
Premium
Image of financial data processing over dark background. global connections, data processing and digital interface concept digitally generated image.
Digital Financial Data Over World Map in Data Center
Smiling Woman with Digital Medical Data Interface
Financial Data Streams and City Traffic Concept
Smart City and Financial Growth with Digital Graphs
Premium
Management data System KPI connected in database for follow earnings,operations and sales data.Businessman using KPI dashboard.Financial business data analytics graph dashboard.
Digital Financial Statistics and Data Over Dark Background
City Skyline with Abstract Financial Graph Overlay
Dynamic Stock Charts Intertwined with Boardroom Image
Digital Data Analysis Over Cityscape with Scope Overlay
Premium
A hand interacting with financial data graphs on a digital interface, set against a blurred office background
Dynamic Financial Data Analysis Charts with Green Digital Grid
Futuristic Digital Globe with Financial Data and Coding
Futuristic Crypto Finance Dashboard with Digital Technology Imagery
Digital Financial Graphs Overlaid on Urban Skyline
Digital Financial Charts Overlayed on Cityscape Background
Abstract Digital Finance Graph Interface Display
Premium
Businessman analyze and visualize complex information on a virtual screen using AI to process data. Big data technology and data science.Data flow.Digital neural network.artificial intelligence
Digital Financial Data Display with Graphs and Metrics
Finance Data Learning: Economic Trends and Market Analysis
Digital Data Processing with Graphs and Coding Visualization
Abstract Financial Data Analysis with Dynamic Graphs on Green
Premium
Man look at the dashboard with graphs and charts. Concept of data management system, business intelligence, data statistics, marketing analysis, key performance indicators (KPI) and analytics.
Colorful Graph Displaying Stock Market Trends on Digital Grid
Digital Global Stock Market Analysis Over World Map
Glowing Digital World Map with Financial Data Synthesis
Abstract Data and Technology with Business Facilitator
Premium
Business finance data analytics graph.Financial management technology.Advisor using KPI Dashboard on virtual screen.
Digital Data Security and Global Internet Connections Concept
Digital Financial Data Technicolor Motion Chart
Digital Data Visualization with Futuristic Infographics
Global Business Data Visualization with Cityscape and World Map
Premium
Advisor using KPI Dashboard on virtual screen.Business finance data analytics graph.Financial management technology.
Global Financial Data Overlay on Digital World Map
Futuristic Digital Interface with Global Finance Graphs
Financial Statistics Overlay in Modern Office Interior
Digital Financial Data Visualization Over Dusk Cityscape
Premium
Business finance data analytics graph.Financial management technology.Advisor using KPI Dashboard on virtual screen.
Financial Data Analytics and Global Cityscape with Futuristic Display
Asian Businessman Analyzing Data in Modern Server Room
Financial Data Processing Code Over Digital Graph
Abstract Stock Market Graph with Digital Data Animation
Premium
KPI Dashboard on virtual screen. Businessman analysing finance data graph on stock market. Financial management technology.	
Dashboard a wallet Account digital.
Digital Interface Overlaid on Retail Environments Reflecting Market Data
Analytical Dashboard with Candlestick Chart and Dotted Trend Line
Digital Financial Data Visualization with Office Background
Digital Green Financial Markets with Cryptocurrency Trends
Digital Financial Data on Black Background with Graphs
Digital Financial Data and Market Analytics Concept
Premium
Hand holding smartphone displays data visualizations, including histogram and pie chart. Analytics, digital transformation and increasing use of mobile technology in business. Minimalist art collage.
Dynamic Financial Graphs Over City Background
Data Processing Digital Interface with Neon Graphs and Code
Abstract Financial Data and Green Market Graphs Overlay
Global Financial Data Analytics with World Map and City Background
Premium
Scientist working with business data, finance, marketing report, Big Data Analytics technology, Processing Complexity information flow on virtual screen, machine learning, artificial intelligence, ML
Global Financial Data Analytics Over Digital World Map
Global Financial Data Technology Display Across World Map
Global Business Data Analytics on World Map
Stock Market Data Overlaid on Urban Construction Scene
Premium
Businessman using futuristic user interface with virtual data analytics. Innovative dashboard with financial charts, graphs, and global network information for business intelligence.
Futuristic Financial Data Analysis with Dynamic Charts and Graphs
Digital Financial Data Visualization with Graphs and Charts
Global Data Exchange and Stock Market Analysis Over World Map
Abstract Financial Data Processing Visualization in Digital Environment
Premium
Business 2025 analytics tools charts and graphs with statistics to analyze business potential and forecast future development of companies growth. Businessman using a tablet.
Futuristic Data Analysis Overlaying Cityscape Digital Interface
Digital Stock Market Data with Fluctuating Numbers and Graphs
Abstract Financial Data Display with Global Stock Market
Dynamic Financial Data Visualization on Blue Background
Premium
Big data technology and data science. Data scientist analysing and visualizing complex data set on virtual screen. Computing, genomics, artificial intelligence, machine learning, business analytics.
Financial Data Visualization with Binary Coding in Green-Blue Palette
Dynamic Financial Data Projection in Modern Office Environment
Digital Data Processing with Code and Graphs on Black Background
Global Digital Data Processing on World Map with Graph and Network Overlay
Premium
Multi exposure of virtual abstract financial graph interface on modern interior background, financial and trading concept
Displaying green 3D dotted market curve and candlestick trading dashboard