1. Home > 
  2. Stock Photos > 
  3. Digital Financial Data Processing Over Grid with Global Map

Digital Financial Data Processing Over Grid with Global Map Image

Digital Financial Data Processing Over Grid with Global Map

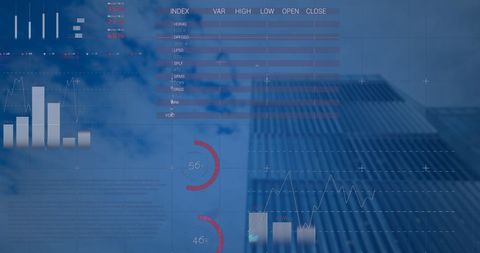
This depiction of financial data processing displays bar graphs and line graphs against a digital grid with a faint world map. This imagery is suited for presentations on global finance, economic trends, data analytics, or business technology. The clear depiction of data makes it appealing for educational content or workshops demonstrating market analysis tools.

Powered by Adobe logo
A holographic bar chart of financial data emerging from a futuristic black device on a dark background - Powered by AdobeFuturistic data center with glowing servers and 3D financial chart overlay. - Powered by AdobeBusiness growth concept with rising arrow and gear icons showing teamwork and process efficiency. - Powered by AdobeFuturistic 3D abstract bar graph representing big data analysis, business processing, and digital technology isolated PNG with Transparent Background - Powered by AdobeAbstract blue illustration of financial data charting with connected lines, dark background - Powered by Adobe

Credit Photo

If you would like to credit the Photo, here are some ways you can do so

Free (free of charge)

Free for personal and commercial use.

Author: Awesome Content

Similar Free Stock Images

Global Financial Data Analytics Concept with Blue Graphs
Premium
A 3D bar graph illustrating growth analytics with a rising arrow
Digital Data Analysis Graphs on Blue Background
Premium
Modern digital background with various data visualization charts including bar graphs, pie charts, and line graphs, representing business analytics and financial data.
Premium
Business analyst working on laptop with holographic dashboard charts and data visualization graphs. Concept of big data, analytics, business intelligence, and financial statistics. crm marketing
Abstract Financial Data and Analytics Visualization
Global Connectivity and Financial Analysis
Financial Data Analysis Overlaying a High-Tech Server Room
Premium
Digital blue stock market analysis graph showing fluctuation and data processing on screen display.
Digital Graph Interface Illustrating Financial Data Analysis
Digital Financial Data with Upward Trend Arrow
Dynamic Data Graph with Futuristic Technology Background
Overlay of Digital Analytics Panels in Modern Office
Premium
Colorful bar chart showing data analysis and growth
Increasing Financial Graph with Urban Cityscape Background
Financial Data Trend Analysis with Graphs on Green Background
Futuristic Global Data Analytics and Visualization Concept
Digital Business Graphs with Growth and Analysis Concepts
Digital Data Graphs Overlaying Urban Background
Futuristic Financial Analytics with Data Charts and Graphs
Digital Bar and Line Chart with Financial Growth Analysis
Digital Data Analytics Interface Over Urban Skyline
Premium
Abstract digital data visualization with glowing lines and bars representing financial or scientific data
Dynamic Data Visualization with Graphs over Blue Background
Global Financial Data Analysis with Digital World Map Visualization
Dynamic Financial Data Visualization in Digital Blue
Digital Data Overlay on Cityscape Signifying Global Business Technology
Premium
A hand presenting a virtual bar chart illustrates increasing growth with digital lines and a futuristic backdrop, symbolizing financial success and analytics. Copula
Visualizing Financial Data Overlaying AI Conceptual Brain
Abstract Digital Interface Analyzing Global Financial Data
Futuristic Data Patterns with Global Connections
Financial Data Analysis on Transparent Grid Background
Financial Data Overlay with Wind Turbines in Background
Digital Bar Graph on Dark Global Business Interface
Futuristic Blue Analytics Dashboard Displaying Holographic Area and Bar Charts with Global Data Grid
Financial Data Analysis Graph on Blue Background Concept
Digital Data Analysis Concept with Cloudy Sky Background
Premium
Vivid, colorful abstract representation of data visualization
Financial Data Visualization in Modern Office
Financial Bar Graph Over Urban Cityscape
Premium
Glowing circuit board with green data bars representing digital information flow and processing, ideal for technology and innovation concepts, on a dark background
Abstract Financial Data Charts with Glowing Infographic Overlay
Digital Interface with Data Charts and Graphs Illustration
Futuristic Financial Data and Analytics Visualization
Financial Data Visualizations on Abstract Blue Background
Premium
Ascending arrow and bar graph with upward trend over a circuit board indicating increasing profits, growth, or success
Digital Financial Graph Overlaying Cityscape
Digital Graph Overlay on Cityscape Visualizing Business Data
Data Processing and Analytics Over Cityscape at Night
Financial Data and Stock Market Decline Visualization
Premium
Person using tablet with glowing flowchart and bar chart icons representing business strategy
Global Data Analytics with Interactive World Map and Diagrams
Digital Holographic Business Growth Charts
Financial Bar Graph Overlaying Urban Cityscape Background
Digital Charts Displaying Data Analytics in Technology Background
Premium
Abstract digital background with glowing spiral, bar graph, and gears, representing data analysis, technology, and business growth concept
Abstract Data Analysis Concept with Gradient Background
Abstract Digital Data Processing in Blue Interface
Digital Finance Data and Statistical Graphs on Dark Background
Abstract Financial Data with Server Room Overlay and Charts
Abstract Financial Growth Graph with Urban Skyline
Digital Interface with Data Processing and Graphs
Digital Interface with Global Data Processing Concept
Financial Graph with European Stars Highlight Global Market Trends
Premium
A hand holds a tablet that showcases a vibrant digital financial graph with an upward trend, symbolizing data analysis and growth in a modern financial context. Copula
Data Processing Visual Concept with Blue Abstract Background
Digital Data Overlay on World Map Representing Global Analytics
Digital Representation of Data Processing in Global Business
Digital Data Processing and Analysis Visualizations
Premium
Gold mining data analysis concept with gravel sieve and digital chart overlay on construction site background
Futuristic Data Analytics and Visualization Interface
Financial Charts with Upward Trend and Analysis Tools
Financial Data Analysis with Modern Building Architecture
Futuristic Data Interface with Business Graphs Against Urban Backdrop
Premium
Isometric bar chart presenting sales, growth, and user statistics across four quarters, visualizing financial performance and data analysis with colorful transparent blocks
Financial Data Visualization on Blue Graphical Background
Financial Data Analysis with Growth Charts Symbolizing Global Business
Digital Graphs and Trading Data Visualization in Dark Composition
Abstract Financial Data Analysis on Blue Digital Background
Premium
AI generated 3D bar chart and line graph with glowing grid background representing stock market trend analysis financial data and modern digital investment concept
Premium
Businessman's hand touching a glowing virtual bar chart displaying increasing financial data and various business process icons, representing progress and digital transformation
Cybersecurity Analytics: Data Graph and Digital Lock Interface
Financial Data Processing in High-Tech Environment
Financial Data Visualization and Digital Analysis with World Map
Financial Graph Overlay with Cityscape Background
Premium
Abstract infographic representing data analysis and growth, featuring bar charts, circles, and lines on a textured background, suitable for technology, finance, and business concepts.
Financial Data Processing with Complex Graphical Interface
Financial Graph Overlay on Cityscape Illustrating Market Trends
Digital Financial Data Processing with Blue Background
Displaying futuristic analytics dashboard with dual charts, neon blue HUD metrics
Premium
Growth Strategy Digital Progress Bar
Cybersecurity Shield Protecting Digital Financial Data
Premium
A man in a dark shirt interacts with a digital interface displaying email icons, rising bar graphs, and network connections, symbolizing data analysis.
Abstract Financial Data Charts with Analytics and Trends
Futuristic Business Data Analysis Against Skyline Backdrop
Digital Data Chart on Blue Background with Grid Lines
Abstract Business Growth Chart with Increasing Bar Graph
Digital Data Analysis Over Blue Background
Abstract Financial Growth Chart with Rising Bars and Line Graphs
Digital Financial Data Analysis Over Modern Server Center
Financial Data Analytics in Digital Interface Design
Digital Data Interface on Office Desk Monitor in Blue Tones
Futuristic Digital Data Analysis Background with Bar Graphs
Abstract Financial Charts and Data Visualizations
Premium
Professional hand typing on laptop keyboard alongside colorful bar chart with rising red arrow. Concept of business growth, performance analysis, data trend in nighttime office work setup.
Futuristic Data Visualization Bar Graph Concept
Abstract Financial Chart with Statistics on Yellow Background
Digital Financial Analytics with Zero Percent Concept
Abstract Financial Charts and Technological Data Visualization
Premium
A professional businessman interacting with a digital interface displaying data analytics and visualizations representing insights and strategic decision making processes
Digital Interface with Descending Red Arrow and Data Diagrams
Financial Data on Office Desk with Digital Charts
Financial Bar Graph Overlapping Modern City Skyline
Financial Data and Graphs on Digital Blue Background
Premium
Hands Holding Abstract Blue and Red Data Visualization.
Data Processing Visualization with Digital Charts on Blue Background
Financial Bar Graph Over Modern Cityscape with Abstract Digital Interface
Digital Bar Graph with Blue Background Indicating Data Analysis
Abstract Global Data Interface with UK Flag and Cloud Background
Premium
Growth chart in blue with rising bars illustrating upward trend in data representation
Bar Graph with Grid on Abstract Blue Background
Futuristic Financial Data Analysis Interface with Graphs
Data Analytics Infographic with Analytics and Skyscraper Overlay
Premium
Bar chart with glowing column and circuit patterns. Business growth and financial success concept in digital technology.
Abstract Holographic Business Graphs with World Map Visual
Explore More Free Stock Images