
- Home >
- Stock Photos >
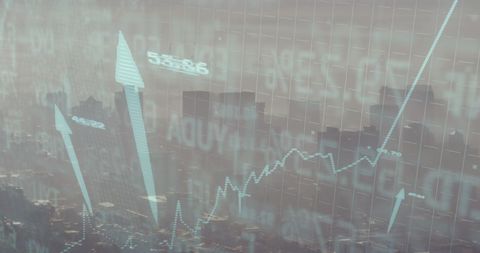
- Digital Financial Data Processing with Futuristic Interface
Digital Financial Data Processing with Futuristic Interface Image

Overlay of financial data graphs against background of modern building shows advanced data processing technologies useful for businesses dealing with global market trends and financial forecasting. Ideal for use in articles or presentations related to finance, technology integration, stock market analysis, or futuristic business strategies.
Powered by  - Get 15% off with code: PIKWIZARD15


downloads
Tags:
More
Credit Photo
If you would like to credit the Photo, here are some ways you can do so
Text Link
photo Link
<span class="text-link">
<span>
<a target="_blank" href=https://pikwizard.com/photo/digital-financial-data-processing-with-futuristic-interface/25acac6bda77ed290c20b98e63031333/>PikWizard</a>
</span>
</span>
<span class="image-link">
<span
style="margin: 0 0 20px 0; display: inline-block; vertical-align: middle; width: 100%;"
>
<a
target="_blank"
href="https://pikwizard.com/photo/digital-financial-data-processing-with-futuristic-interface/25acac6bda77ed290c20b98e63031333/"
style="text-decoration: none; font-size: 10px; margin: 0;"
>
<img src="https://pikwizard.com/pw/medium/25acac6bda77ed290c20b98e63031333.jpg" style="margin: 0; width: 100%;" alt="" />
<p style="font-size: 12px; margin: 0;">PikWizard</p>
</a>
</span>
</span>
Free (free of charge)
Free for personal and commercial use.
Author: People Creations
Similar Free Stock Images

Premium


Premium

Premium


Premium


Premium


Premium


Premium


Premium


Premium

Premium


Premium


Premium


Premium


Premium


Premium


Premium


Premium


Premium


Premium


Premium

Premium


Premium
Premium


Premium


Premium


Explore More Free Stock Images