1. Home > 
  2. Stock Photos > 
  3. Digital Financial Data Processing with Futuristic Screens

Digital Financial Data Processing with Futuristic Screens Image

Digital Financial Data Processing with Futuristic Screens

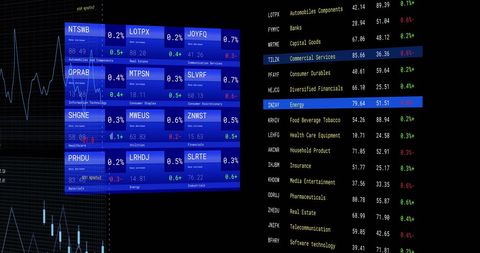
Detailed visual of digital screens displaying financial data emphasizes the advancement in financial technology and data processing. The black background reinforces the modern, high-tech thematic. Suitable for illustrating concepts in business finance, showing advanced data analysis techniques, or promoting financial technology solutions and tools.

Powered by Adobe logo
Financial market candlestick chart showing price fluctuations with green and red bars on a dark digital background, representing stock or cryptocurrency trading data. - Powered by AdobeBullish stock trend line in neon green against a dark digital grid background, high contrast modern design - Powered by AdobeModern computer monitor displaying a stock market chart isolated on transparent background, showcasing financial data and investment trends in a digital format - Powered by AdobeClose-up view of dynamic financial market data displayed on a digital screen, showing fluctuating stock exchange charts and investment trends for business analysis - Powered by AdobeYoung man and woman analyze stock market data on computer screens with graphs. Colleagues work together at night in modern office, studying financial information on digital displays. - Powered by Adobe

Credit Photo

If you would like to credit the Photo, here are some ways you can do so

Free (free of charge)

Free for personal and commercial use.

Author: People Creations

Similar Free Stock Images

Digital Financial Data Analysis with Infographics and Charts
Premium
A focused young Asian woman analyzes complex financial data and stock market trends on multiple glowing digital screens in a high-tech control room.
Digital Financial Data with Graph and Grid Patterns
Dynamic Stock Market Data With Digital Trading Analysis
Financial Data Analysis Vibrant Graphs on Blue Background
Analyzing Stock Market Data Trends with Futuristic Visuals
Dynamic Stock Market Analysis Concept Artwork
Premium
A dynamic, close-up, and highly detailed perspective shot of a digital stock market ticker or financial data screen. The image is dominated by a deep, intense blue color palette, giving a futuristic.
Dynamic Statistical Data Analysis on Digital Grid Network
Dynamic Stock Market Trends with Graphs on Digital Display
Cybersecurity Interface with Digital Shield Icon Displayed
Rising Financial Data Graph on Digital Grid Background
Premium
Close up of a businessman s hand pointing at a glowing upward trending financial stock market graph on a digital tablet screen
Financial Data Overlays Cityscape Signifying Market Dynamics
Digital Financial Data and Global Business Analytics
Rising Graphs and Interactive Financial Data Analytics Background
Colorful Bar Graph with Data Overlay on Black Background
Premium
A person's hand presents a futuristic holographic chart showing financial growth predictions for 2026. Data includes bar graphs, trend lines, and fluctuating numbers on a dark background.
Futuristic Data Terminal with Code and Digital Interface Overlay
Digital Interface Visualizing DNA and Data Patterns
Abstract Digital Charts with Social Media Metrics Rising
Financial Data Analysis with Declining Trends
Premium
Businessman interacting with digital forex and stock market chart interface showing buy and sell decisions with futuristic holographic data overlay.
Financial Data Visualization in Modern Digital Display Office
Holographic Charts with Social Media Notifications
Financial Growth Graph and Data Analytics Representation
Digital Heart Rate Monitor with Vital Signs Interface
Dynamic Financial Data Overlaid on Grid Background
Digitized Financial Data Analysis with Graphs and Codes
Financial Visualization Overlooking Urban Cityscape
Digital DNA Strand Visualization on Modern Interface Background
Premium
Laptop screen displaying financial charts
Dynamic Business Data and Cityscape Visualization
World Map with Falling Line Graphs Indicating Global Economic Decline
Digital Data Visualization with Trend Lines and Percentage Changes
Dynamic Financial Data Graph in Digital Grid Display
Digital Interface with Data Graphs and Charts
Digital Cityscape with Financial Data Overlay
Premium
Close-up of digital financial charts and graphs on a dark blue background, with orange accents. Data visualization, charts, and graphics.
Dynamic Financial Data Streams for Market Analysis
Premium
Business people watching financial data analysis on a large screen
Digital Financial Data Display Tracking Market Trends
Digital Financial Data Overlay on Urban Street Scene
Digital Financial Data Analysis on Grid Framework
Jagged Line Chart Showing Social Engagement Notifications on Dark Blue Grid with Metric
Premium
Man analyzes stock market data on glowing screen in dim, futuristic office
Digital Data Processing with Graphical Interface
Holographic Financial Stock Market Analysis Visualization
Financial Data Visualization with Cityscape Overlay
Financial Data Analysis with Growing Stock Trends
Premium
A person's hands hold a smartphone displaying a stock market chart with red and green candles, indicating price fluctuations, against a blurred background showing more financial data
Stock Market Trends Visual with Growth Charts on Black Background
Digital Chart Display Financial Data Analysis Background Effects
Neon Green Analytics Graph Showing Encryption Hex Dump on Dark Multiscreen Dashboard
Holographic Financial Data Visualization with Stock Trends
Premium
Business financial chart with moving up arrow graph.Financial data charts with glowing stock market graphs.Stock market investment data and analysis finance graph.
Dynamic Stock Market Data Visual Collage
Dynamic Financial Graphs Over Cityscape Background
Financial Data Streaming with Arrows Over Graphic Indicators
Financial Data Overlay on Urban Skyscrapers
Premium
Futuristic stock market or trading graph suitable for financial investments economic trends and business ideas Abstract finance background
Global Financial Data with Dynamic Analytics Visualization
Sound Wave Visualization with Programming Code Elements
Dynamic Financial Growth Digital Chart Display
Financial Data Analysis with Code Interface on Black Background
Premium
Businessman in suit observing financial stock market data charts on multiple screens
Premium
Indian trader with screens displaying financial graphs and market data.
Premium
A hand holding a pen points to a bright stock market chart on a digital screen with fluctuating green and red graph lines indicating financial data.
Digital Stock Market Trends and Financial Growth Analysis
Futuristic Digital Interface with Spiraling Coding Patterns
Financial Graphs with Social Media Analytics on Digital Chart
Digital Graph over Stock Market Data Concepts
Premium
Colorful digital screen with glowing forex and stock market candlestick chart and data analysis on dark interface background for modern financial display. 3D Rendering
Financial Data Analytics on Digital Interface Displaying Graphs
Digital Financial Data Display Screen with Analytics
Stock Market Graph with Social Media Notifications Overlay
Abstract Digital Interface for Medical Data Processing
Premium
Smiling business woman uses tablet analyzing stock market data at night. Financial growth graphs, data trends overlaid on screen. Successful trader investor monitors investment performance on digital
Financial Graph with Data Analysis and Market Statistics
Financial Data Processing with Digital Patterns for Global Business
Digital Cardiograph Display with Heart Rate and SpO2 Monitors
Abstract Digital Stock Market Analysis with Graphs
Premium
Analyzing stock market data on a smartphone, close-up of hand and phone screen
Global Financial Data Processing with Digital Interface Elements
Financial Stock Market Data Analysis on Digital Interface
Digital Visualization of Global Networking with Statistical Graphs
Rising Digital Graph and Data Visualizations on Black Background
Premium
Magnifying glass examining financial stock market trading charts and graphs on paper with blurred digital screens in background
Financial Data Flow against Urban Skyline Backdrop
Digital Financial Data Analysis with Graphs and Stock Market Trends
Dynamic Green Stock Chart on Digital Grid Background
Dynamic Stock Market Data Analysis With Graphs and Percentages
Premium
Financial market data showing stock performance, growth trends, and investment analysis with digital technology integration for investors
Holographic Stock Market Analysis with Charts and Data
Dynamic Financial Data Visualization on Digital Grid Background
Dynamic Stock Market Chart with Fluctuating Trends and Data Points
Digital Graphs Over Cityscape Representing Global Business Growth
Dynamic Graphic of Financial Data Displayed on Graph
Digital Finance: Modern Stock Market Analysis Display
Abstract Digital Stock Market Interface with Graphs and Data
Dynamic Digital Stock Market Ticker with Growing Graph Trends
Digital Financial Data Visualization on Dark Screen
Digital Financial Data Interface with Analytics
Data Analytics Graphs on Digital Interface Background
Dynamic Stock Market Analysis with Multicolored Statistics
Premium
Abstract digital stock market chart with glowing blue lines and bokeh effects representing financial growth and analysis.
Abstract Financial Market Data with CGI and Code Overlay
Financial Data Visualization with Global Network Overlay
Dynamic Financial Data Graphs Networking in Global Business
Abstract Financial Data Processing and Analysis Interface
Premium
A nighttime cityscape blurred in the background, overlaid by a glowing, dynamic stock market graph displayed on a screen in the foreground
Dynamic Stock Market Analysis on Digital Screen
Financial Data Display in Digital Grid Design
Dynamic Financial Chart Illustrating Stock Market Volatility
Financial Data Processing with Rising Graphs
Premium
Focused male professional analyzes a declining red stock market graph in a modern office. This cinematic image captures the intensity of a financial crisis and economic risk management.
Financial Data Visualization Over Futuristic Cityscape
Digital Finance Data Overload with Code and Graphs
Digital Data Visualization and Analysis Interface
Digital Financial Data Processing Interface on Red Background
Premium
Happy African American businesswoman analyzing stock market data on a digital screen, reviewing trends and graphs. This image is ideal for business and finance content, with space, Generative AI
Premium
A close-up shot of a colorful 3D pie chart resting on a digital screen displaying various financial graphs and data.  The image is dark with vibrant chart colors
Overlay of Financial Data on Business People in Office Building
Colorful Stock Market Display with Graphs and Tickers on Blue Background
Colorful Stock Market Graph Displaying Economic Trends
Explore More Free Stock Images