- Home >
- Stock Photos >
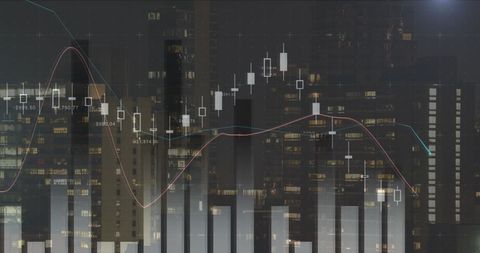
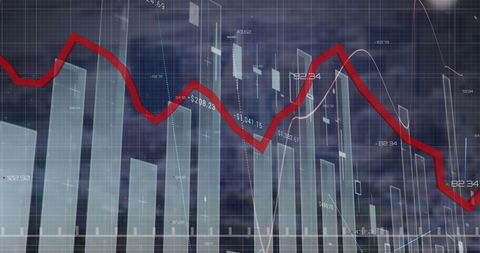
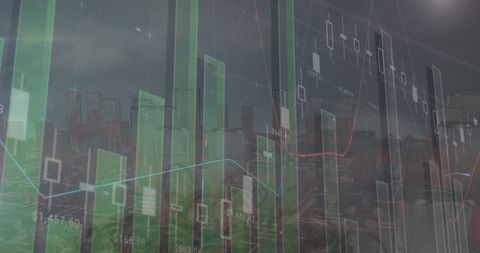
- Digital Financial Data Processing with Graph Lines and Symbols
Digital Financial Data Processing with Graph Lines and Symbols Image

Financial data visualization showing graph lines and numbers, illustrating concepts of digital financial markets and data analysis. Ideal for content on financial analytics, stock market data, fintech solutions, and global economic trends.

downloads
Tags:
More
Credit Photo
If you would like to credit the Photo, here are some ways you can do so
Text Link
photo Link
<span class="text-link">
<span>
<a target="_blank" href=https://pikwizard.com/photo/digital-financial-data-processing-with-graph-lines-and-symbols/89cd2406c2a60f84ad1b5ef662885af8/>PikWizard</a>
</span>
</span>
<span class="image-link">
<span
style="margin: 0 0 20px 0; display: inline-block; vertical-align: middle; width: 100%;"
>
<a
target="_blank"
href="https://pikwizard.com/photo/digital-financial-data-processing-with-graph-lines-and-symbols/89cd2406c2a60f84ad1b5ef662885af8/"
style="text-decoration: none; font-size: 10px; margin: 0;"
>
<img src="https://pikwizard.com/pw/medium/89cd2406c2a60f84ad1b5ef662885af8.jpg" style="margin: 0; width: 100%;" alt="" />
<p style="font-size: 12px; margin: 0;">PikWizard</p>
</a>
</span>
</span>
Free (free of charge)
Free for personal and commercial use.
Author: Awesome Content