
- Home >
- Stock Photos >
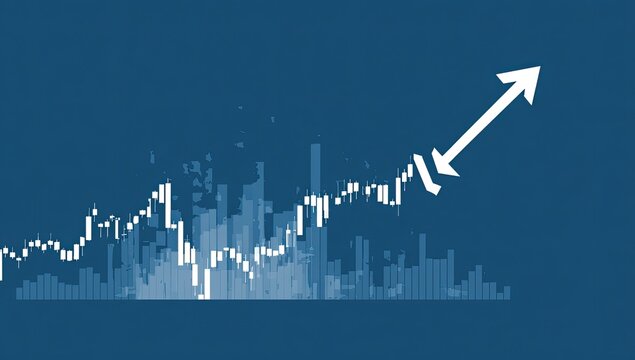
- Digital Financial Data Processing with Graphs and Charts
Digital Financial Data Processing with Graphs and Charts Image

Vibrant visualization showcasing dynamic financial data models against a blue background. Contains graphs and charts suitable for presentations on business analytics, economic trends, and stock market insights. Ideal for use in corporate reports, financial software advertisements, and educational materials related to financial markets and analysis.
Powered by 


downloads
Tags:
More
Credit Photo
If you would like to credit the Photo, here are some ways you can do so
Text Link
photo Link
<span class="text-link">
<span>
<a target="_blank" href=https://pikwizard.com/photo/digital-financial-data-processing-with-graphs-and-charts/085c66d5790e99d12336ce9f2923cdb3/>PikWizard</a>
</span>
</span>
<span class="image-link">
<span
style="margin: 0 0 20px 0; display: inline-block; vertical-align: middle; width: 100%;"
>
<a
target="_blank"
href="https://pikwizard.com/photo/digital-financial-data-processing-with-graphs-and-charts/085c66d5790e99d12336ce9f2923cdb3/"
style="text-decoration: none; font-size: 10px; margin: 0;"
>
<img src="https://pikwizard.com/pw/medium/085c66d5790e99d12336ce9f2923cdb3.jpg" style="margin: 0; width: 100%;" alt="" />
<p style="font-size: 12px; margin: 0;">PikWizard</p>
</a>
</span>
</span>
Free (free of charge)
Free for personal and commercial use.
Author: People Creations
Similar Free Stock Images

Premium


Premium

Premium


Premium


Premium


Premium


Premium


Premium

Premium


Premium


Premium

Premium


Premium


Premium

Premium


Premium


Premium


Premium


Premium


Premium

Premium


Premium


Premium


Premium


Premium


Explore More Free Stock Images