- Home >
- Stock Photos >
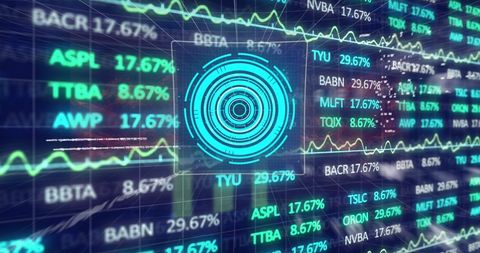
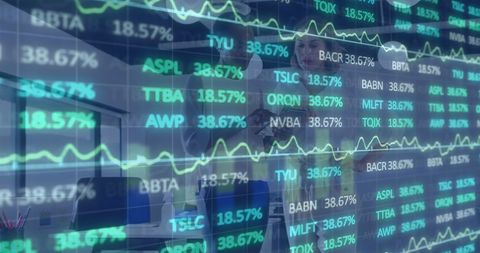
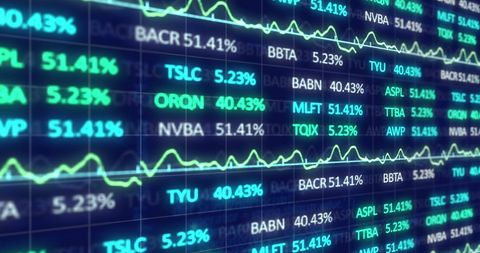
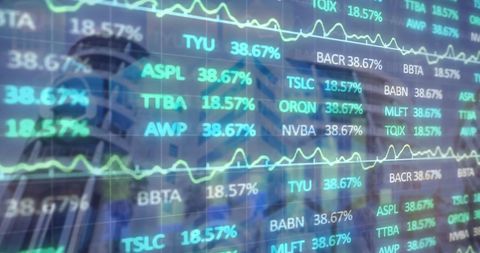
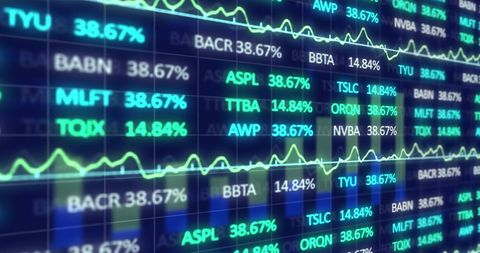
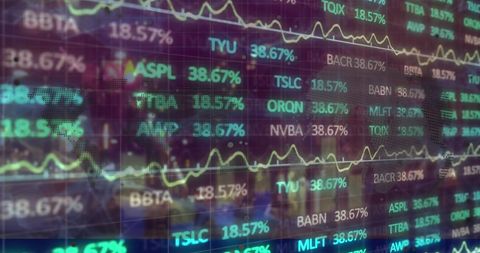
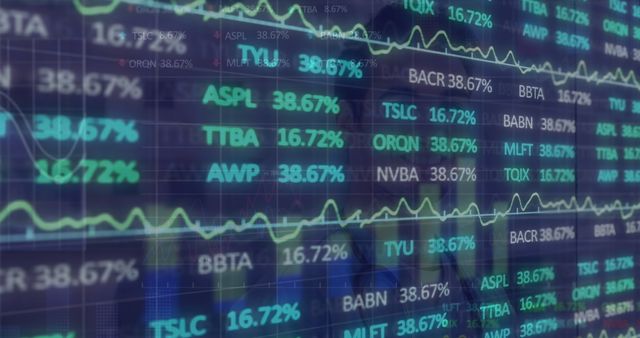
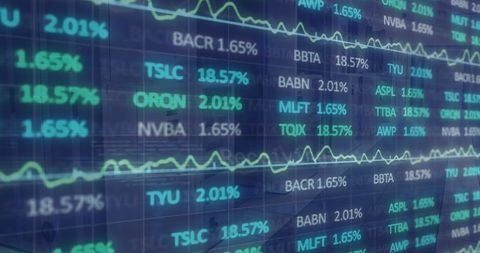
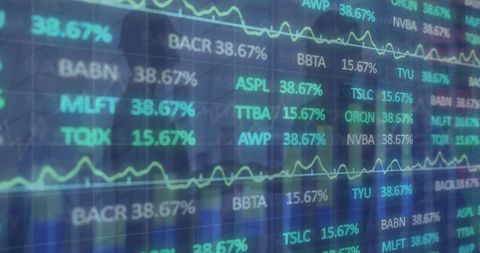
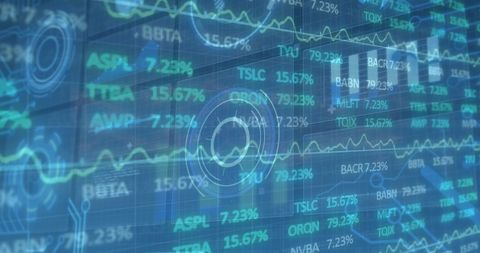
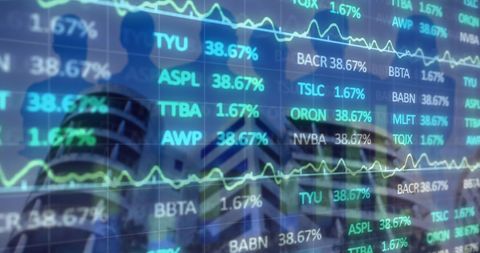
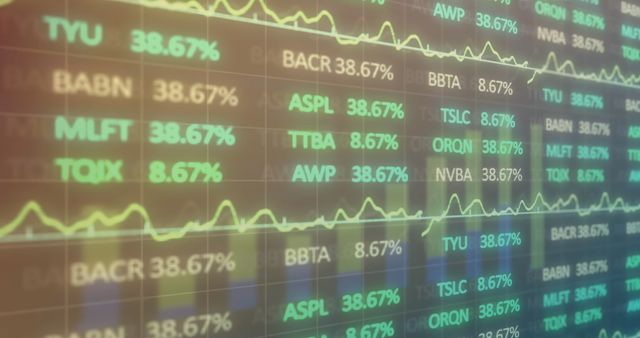
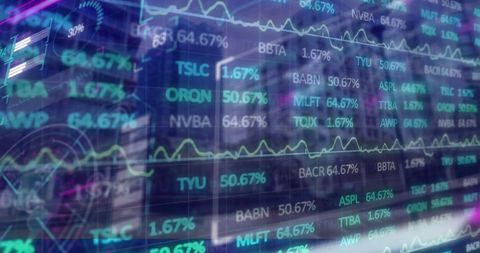
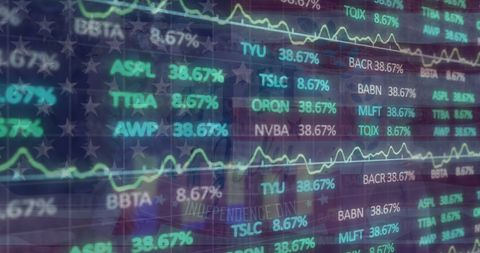
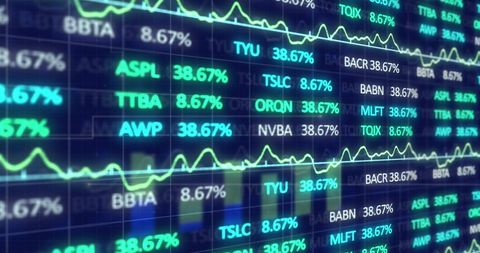
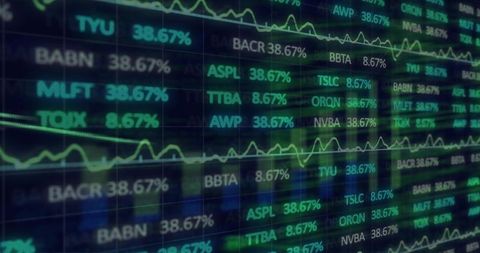
- Digital Financial Data Processing with Interactive Graphs
Digital Financial Data Processing with Interactive Graphs Image
This depiction of digital financial data processing shows various stock indicators, numbers, and graphs, indicating the flow and dynamism of modern commerce and investment trends. It can be used for illustrating topics in financial technology, market analysis, economic forecasts, and digital innovation in the financial sector, and is ideal for presentations, reports, or articles related to finance and global markets.

downloads
Tags:
More
Credit Photo
If you would like to credit the Photo, here are some ways you can do so
Text Link
photo Link
<span class="text-link">
<span>
<a target="_blank" href=https://pikwizard.com/photo/digital-financial-data-processing-with-interactive-graphs/57667779745fece63674a754726ee5b1/>PikWizard</a>
</span>
</span>
<span class="image-link">
<span
style="margin: 0 0 20px 0; display: inline-block; vertical-align: middle; width: 100%;"
>
<a
target="_blank"
href="https://pikwizard.com/photo/digital-financial-data-processing-with-interactive-graphs/57667779745fece63674a754726ee5b1/"
style="text-decoration: none; font-size: 10px; margin: 0;"
>
<img src="https://pikwizard.com/pw/medium/57667779745fece63674a754726ee5b1.jpg" style="margin: 0; width: 100%;" alt="" />
<p style="font-size: 12px; margin: 0;">PikWizard</p>
</a>
</span>
</span>
Free (free of charge)
Free for personal and commercial use.
Author: Awesome Content