- Home >
- Stock Photos >
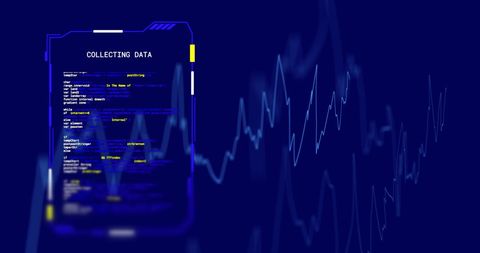
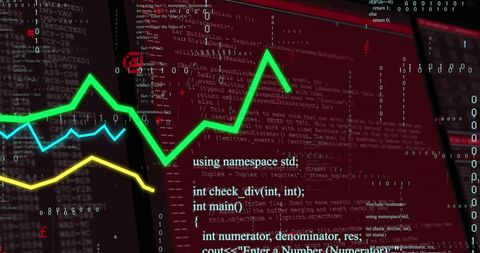
- Digital Financial Data Processing with Trend Lines
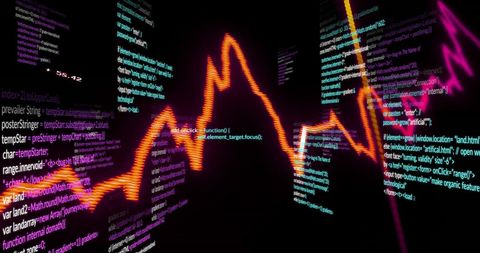
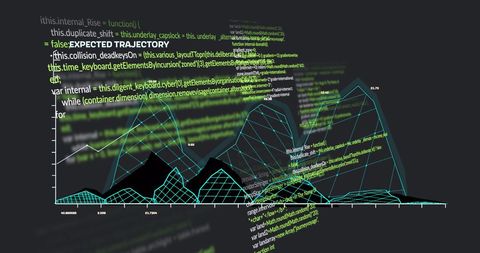
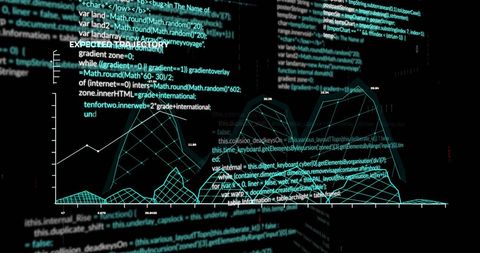
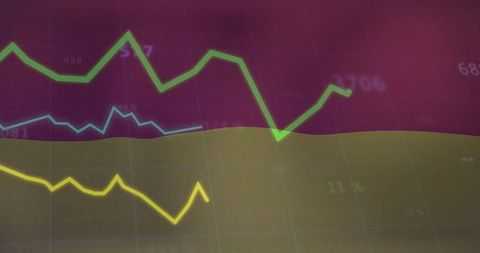
Digital Financial Data Processing with Trend Lines Image

Visual illustrating complex financial data processing with highlighted trend lines. The use of vibrant colors on a dark background emphasizes digital data analysis. Suitable for use in articles about financial technology, data analysis trends, or educational materials explaining financial concepts and digital analytics.

downloads
Tags:
More
Credit Photo
If you would like to credit the Photo, here are some ways you can do so
Text Link
photo Link
<span class="text-link">
<span>
<a target="_blank" href=https://pikwizard.com/photo/digital-financial-data-processing-with-trend-lines/6563d2849868a9420b1425d42761bfaa/>PikWizard</a>
</span>
</span>
<span class="image-link">
<span
style="margin: 0 0 20px 0; display: inline-block; vertical-align: middle; width: 100%;"
>
<a
target="_blank"
href="https://pikwizard.com/photo/digital-financial-data-processing-with-trend-lines/6563d2849868a9420b1425d42761bfaa/"
style="text-decoration: none; font-size: 10px; margin: 0;"
>
<img src="https://pikwizard.com/pw/medium/6563d2849868a9420b1425d42761bfaa.jpg" style="margin: 0; width: 100%;" alt="" />
<p style="font-size: 12px; margin: 0;">PikWizard</p>
</a>
</span>
</span>
Free (free of charge)
Free for personal and commercial use.
Author: Awesome Content