- Home >
- Stock Photos >
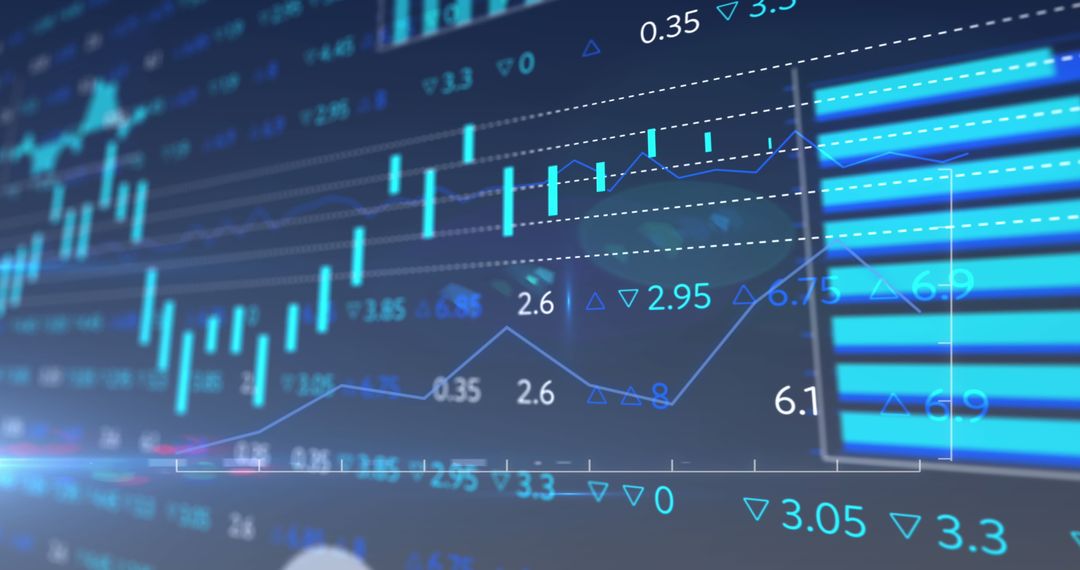
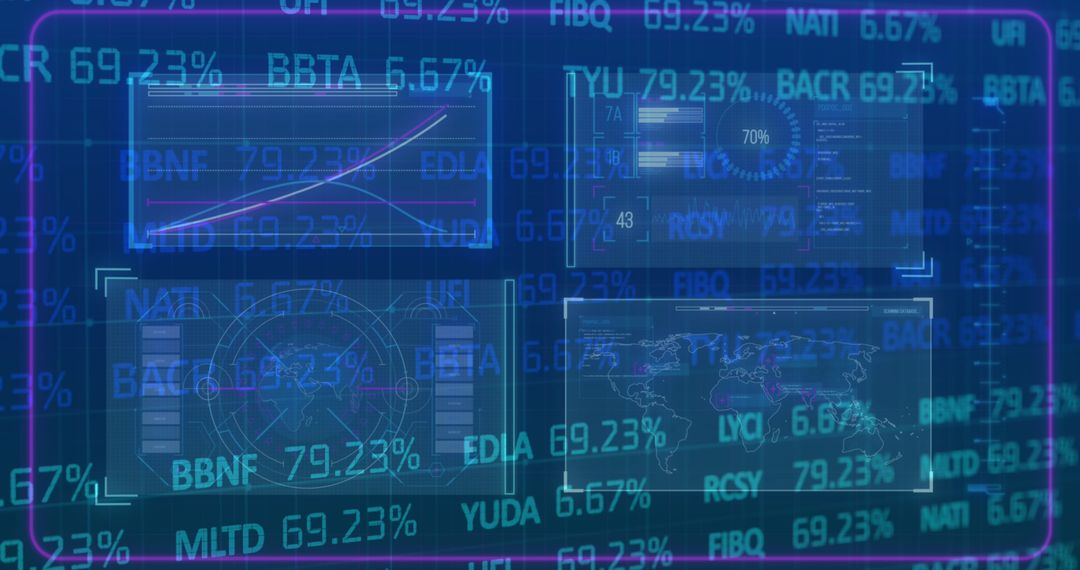
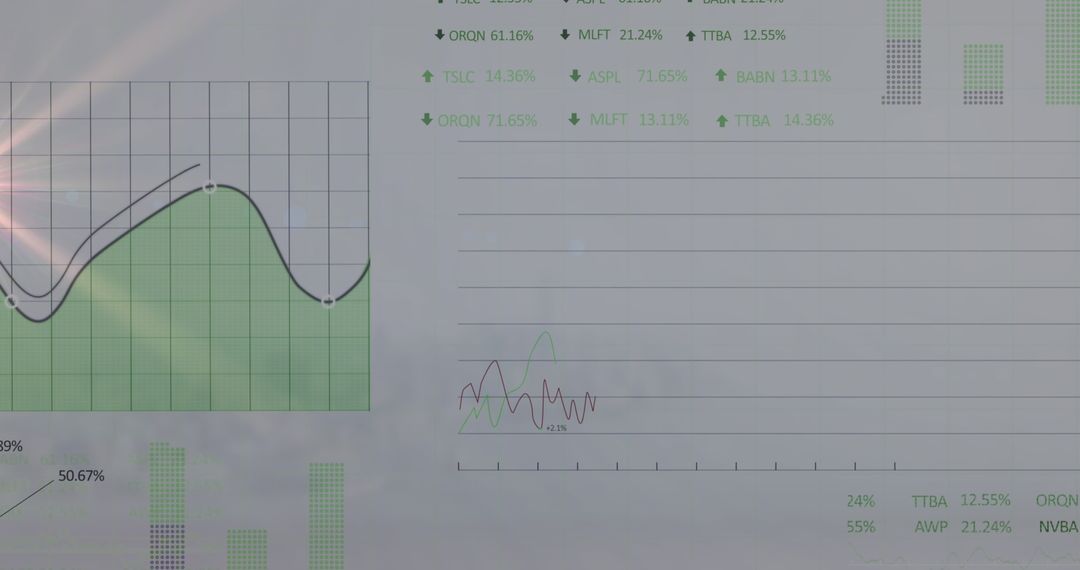
- Digital Financial Data Screens with Graphs and Analytics Interface Concept
Digital Financial Data Screens with Graphs and Analytics Interface Concept Image

Digitally generated visual displaying complex financial data and analytical graphs on a navy blue backdrop. Use for illustrating concepts related to global finance, technological advancement in data analytics, economic trends, and modern trading platforms. Ideal for articles, presentations, and websites focusing on fintech and economic analysis.
Powered by  - Get 15% off with code: PIKWIZARD15


2
downloads
downloads
Tags:
More
Credit Photo
If you would like to credit the Photo, here are some ways you can do so
Text Link
photo Link
<span class="text-link">
<span>
<a target="_blank" href=https://pikwizard.com/photo/digital-financial-data-screens-with-graphs-and-analytics-interface-concept/1191e0a9e1e1517c8c235991462af5b9/>PikWizard</a>
</span>
</span>
<span class="image-link">
<span
style="margin: 0 0 20px 0; display: inline-block; vertical-align: middle; width: 100%;"
>
<a
target="_blank"
href="https://pikwizard.com/photo/digital-financial-data-screens-with-graphs-and-analytics-interface-concept/1191e0a9e1e1517c8c235991462af5b9/"
style="text-decoration: none; font-size: 10px; margin: 0;"
>
<img src="https://pikwizard.com/pw/medium/1191e0a9e1e1517c8c235991462af5b9.jpg" style="margin: 0; width: 100%;" alt="" />
<p style="font-size: 12px; margin: 0;">PikWizard</p>
</a>
</span>
</span>
Free (free of charge)
Free for personal and commercial use.
Author: Creative Art
Similar Free Stock Images

Premium


Premium


Premium


Premium


Premium


Premium


Premium


Premium


Premium


Premium


Premium


Premium


Premium


Premium


Premium


Premium


Premium


Premium


Premium


Premium


Premium


Premium


Premium


Premium