
- Home >
- Stock Photos >
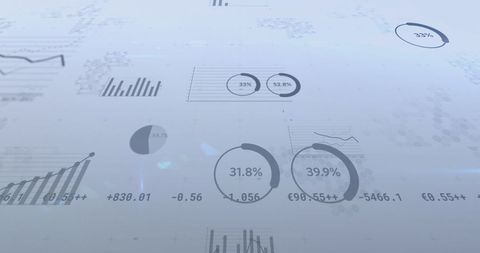
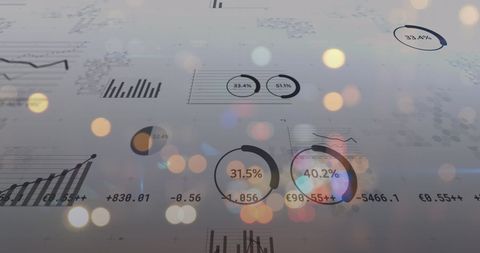
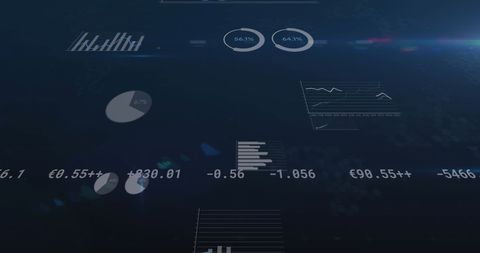
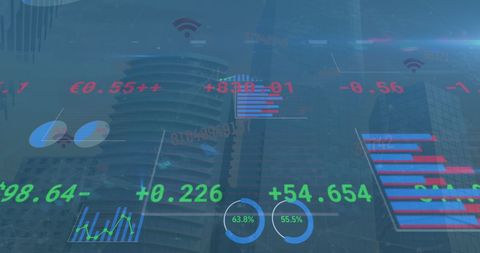
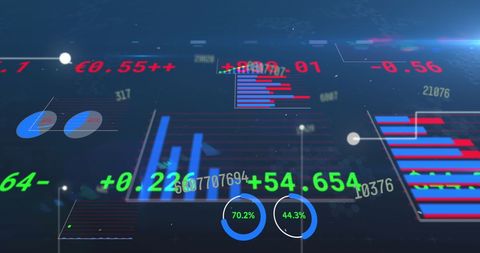
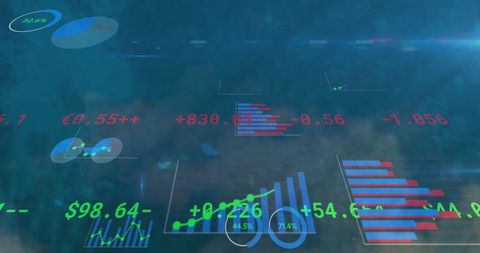
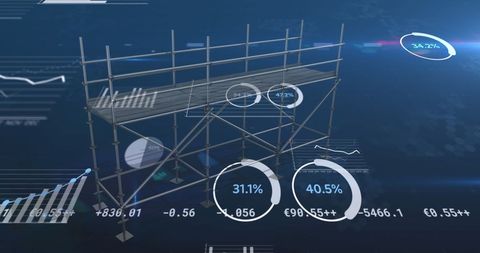
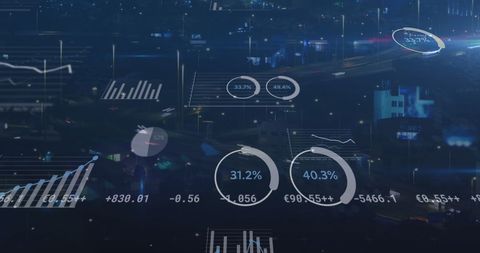
- Digital Financial Data Streaming with Modern Analytics Graphics
Digital Financial Data Streaming with Modern Analytics Graphics Image

Illustrates real-time financial data processing with scattered numbers and graphs. Ideal for using in business presentations about digital analytics, illustrating technological advances in finance, or displaying concepts related to global financial computing and data management.
Powered by 


downloads
Tags:
More
Credit Photo
If you would like to credit the Photo, here are some ways you can do so
Text Link
photo Link
<span class="text-link">
<span>
<a target="_blank" href=https://pikwizard.com/photo/digital-financial-data-streaming-with-modern-analytics-graphics/ec26d33c55e44fd58226cc2be731f019/>PikWizard</a>
</span>
</span>
<span class="image-link">
<span
style="margin: 0 0 20px 0; display: inline-block; vertical-align: middle; width: 100%;"
>
<a
target="_blank"
href="https://pikwizard.com/photo/digital-financial-data-streaming-with-modern-analytics-graphics/ec26d33c55e44fd58226cc2be731f019/"
style="text-decoration: none; font-size: 10px; margin: 0;"
>
<img src="https://pikwizard.com/pw/medium/ec26d33c55e44fd58226cc2be731f019.jpg" style="margin: 0; width: 100%;" alt="" />
<p style="font-size: 12px; margin: 0;">PikWizard</p>
</a>
</span>
</span>
Free (free of charge)
Free for personal and commercial use.
Author: People Creations
Similar Free Stock Images

Premium


Premium

Premium

Premium


Premium


Premium


Premium


Premium


Premium


Premium

Premium

Premium


Premium


Premium


Premium


Premium


Premium


Premium


Premium


Premium


Premium


Premium


Premium


Premium


Premium

Explore More Free Stock Images