
- Home >
- Stock Photos >
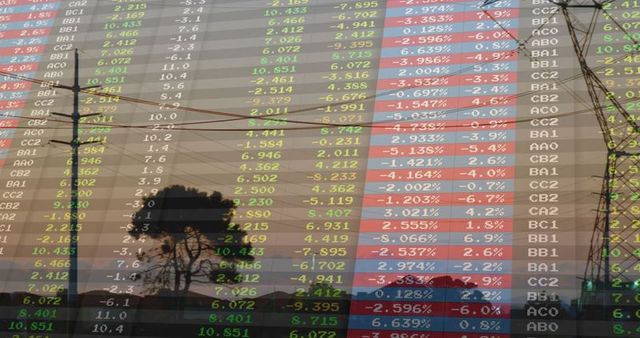
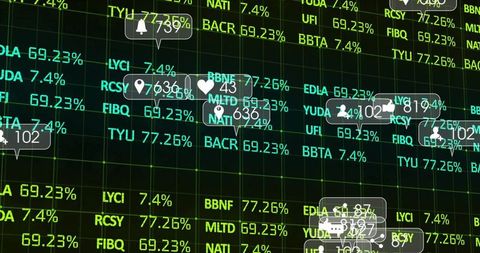
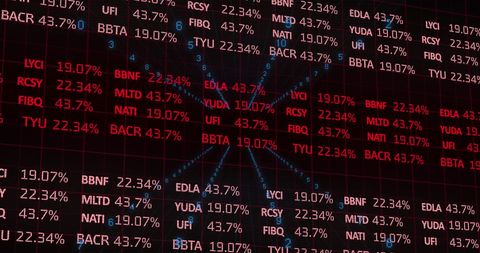
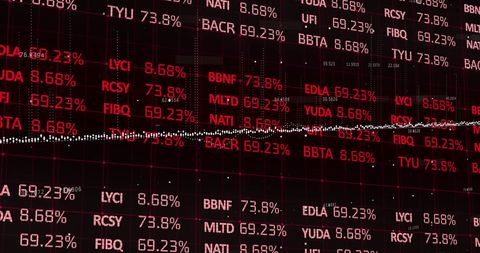
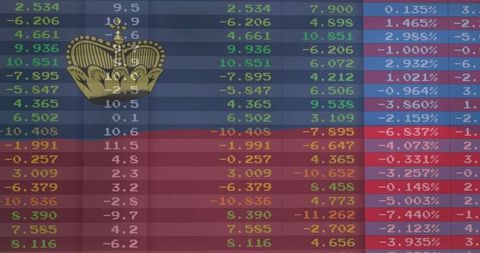
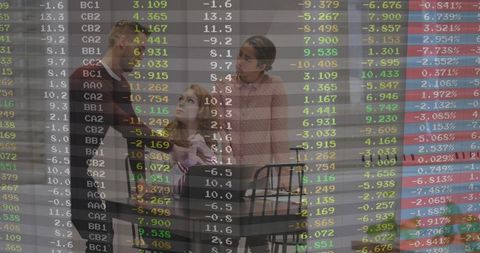
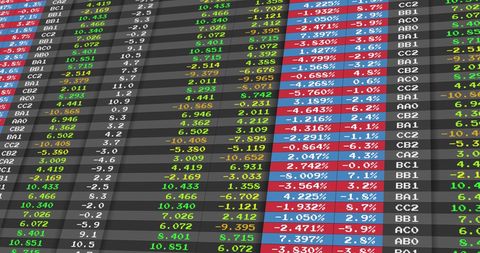
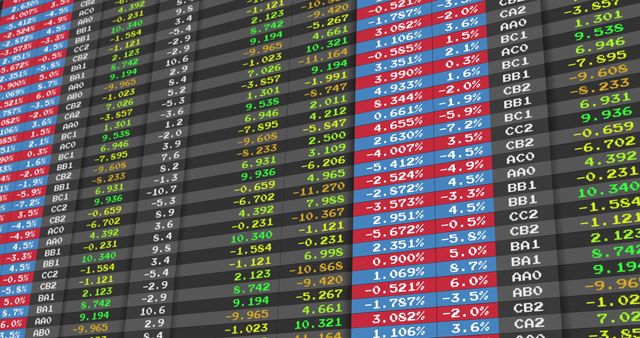
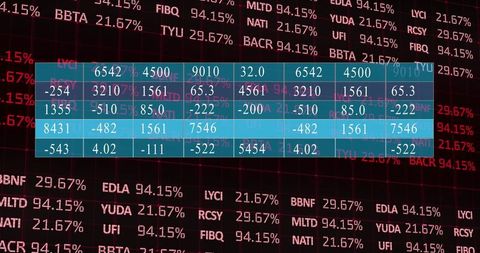
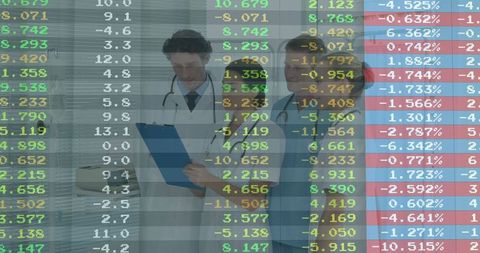
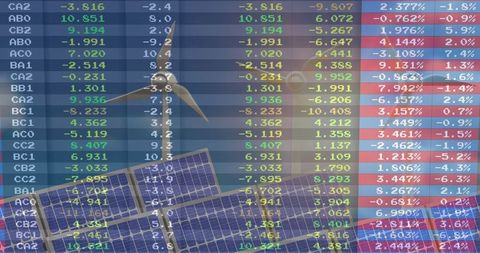
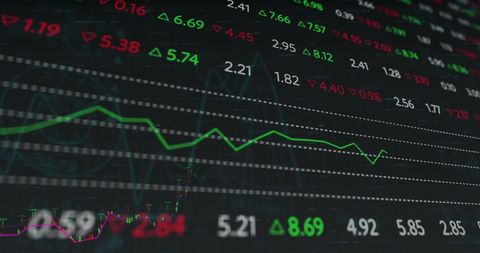
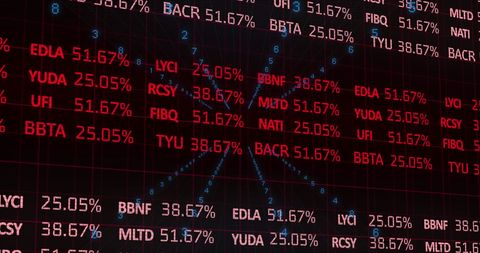
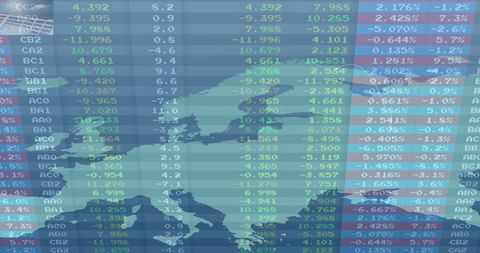
- Digital Financial Data Table with Overlayed Trend Graph
Digital Financial Data Table with Overlayed Trend Graph Image

This detailed visual representation of digital financial data features an overlaid trend graph and is perfect for illustrating concepts in finance and investment fields. It is an ideal fit for presentations, websites, or educational materials discussing stock market trends, financial analytics, or modern investment strategies leveraging technological interfaces.
Powered by 


downloads
Tags:
More
Credit Photo
If you would like to credit the Photo, here are some ways you can do so
Text Link
photo Link
<span class="text-link">
<span>
<a target="_blank" href=https://pikwizard.com/photo/digital-financial-data-table-with-overlayed-trend-graph/46fe2c40efc913e78e64da1442a0cf67/>PikWizard</a>
</span>
</span>
<span class="image-link">
<span
style="margin: 0 0 20px 0; display: inline-block; vertical-align: middle; width: 100%;"
>
<a
target="_blank"
href="https://pikwizard.com/photo/digital-financial-data-table-with-overlayed-trend-graph/46fe2c40efc913e78e64da1442a0cf67/"
style="text-decoration: none; font-size: 10px; margin: 0;"
>
<img src="https://pikwizard.com/pw/medium/46fe2c40efc913e78e64da1442a0cf67.jpg" style="margin: 0; width: 100%;" alt="" />
<p style="font-size: 12px; margin: 0;">PikWizard</p>
</a>
</span>
</span>
Free (free of charge)
Free for personal and commercial use.
Author: Awesome Content
Similar Free Stock Images

Premium


Premium


Premium

Premium


Premium


Premium


Premium

Premium

Premium


Premium

Premium


Premium


Premium


Premium

Premium


Premium


Premium


Premium


Premium


Premium


Premium


Premium

Premium


Premium


Premium


Explore More Free Stock Images