
- Home >
- Stock Photos >
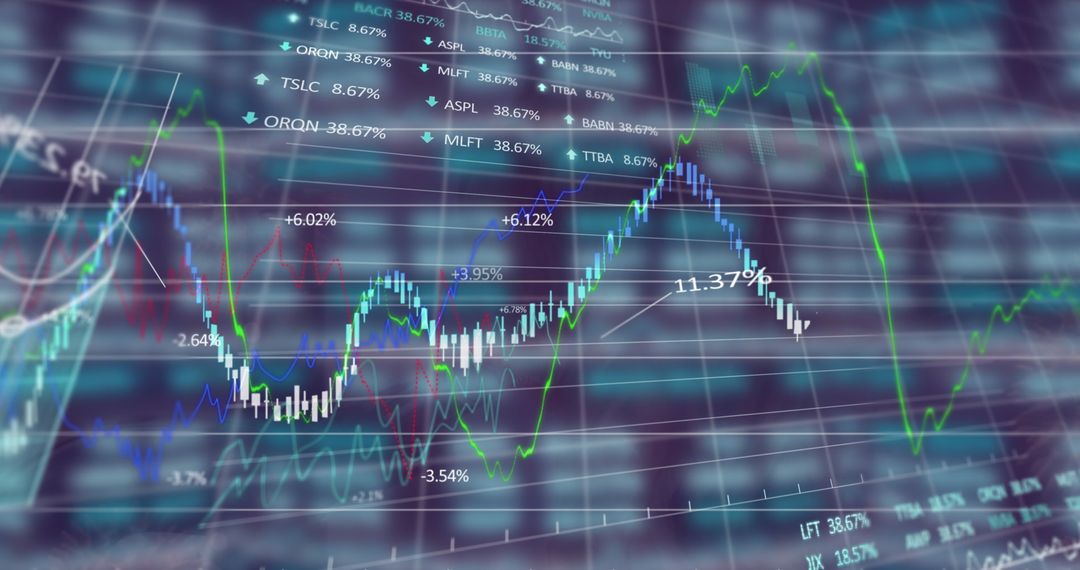
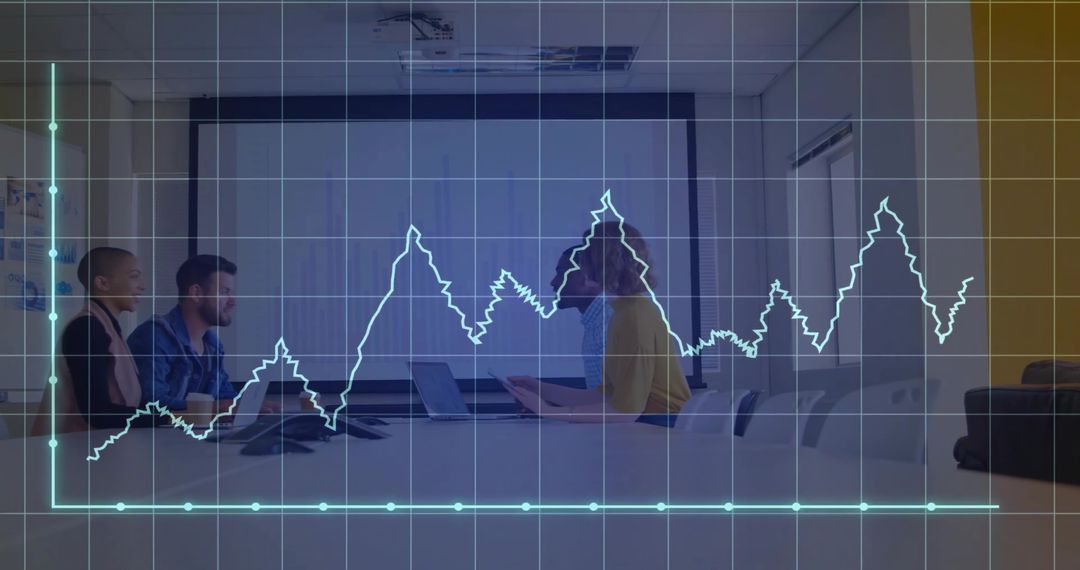
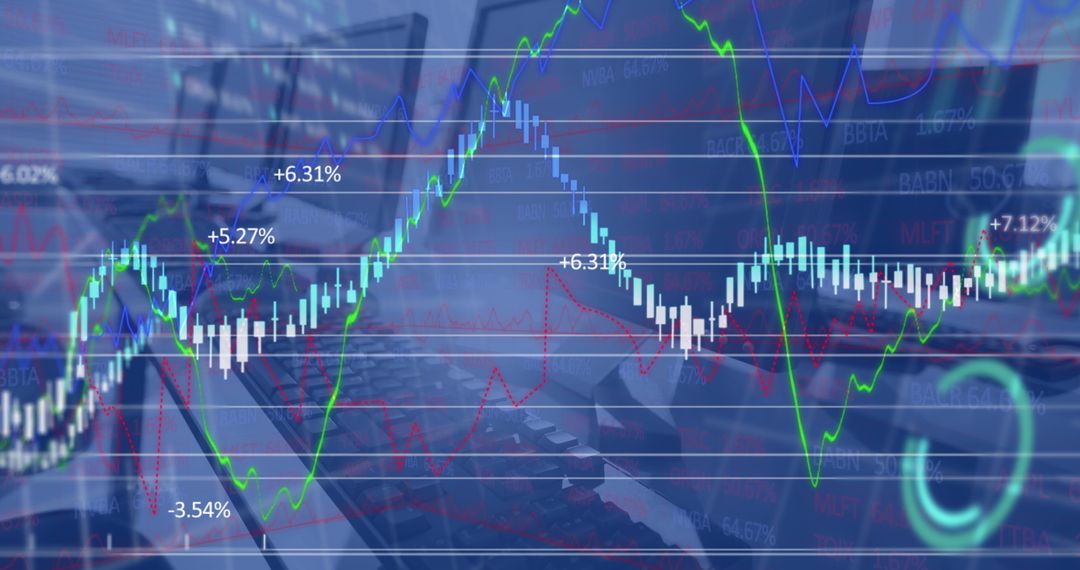
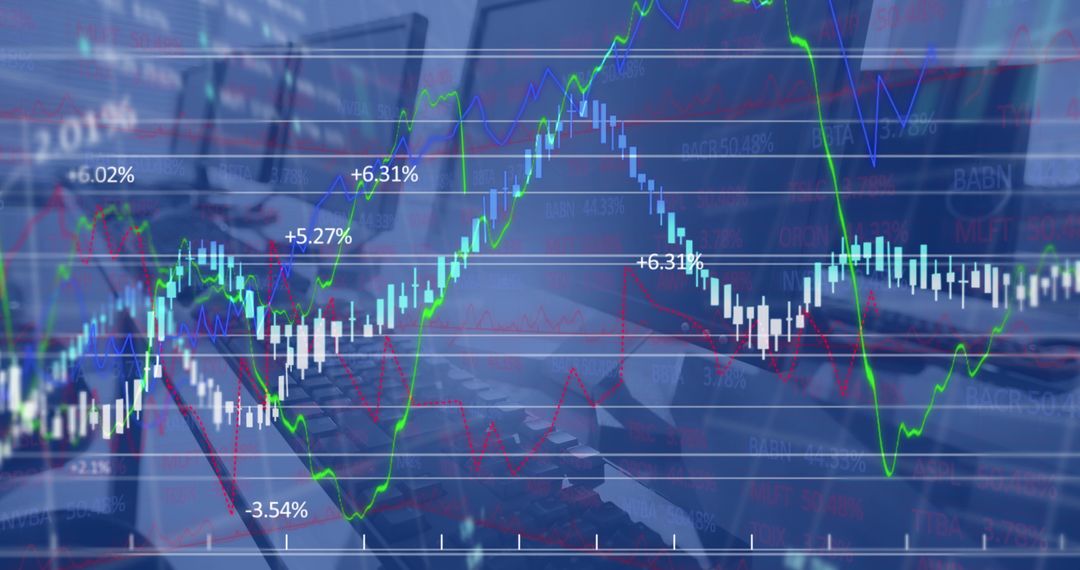
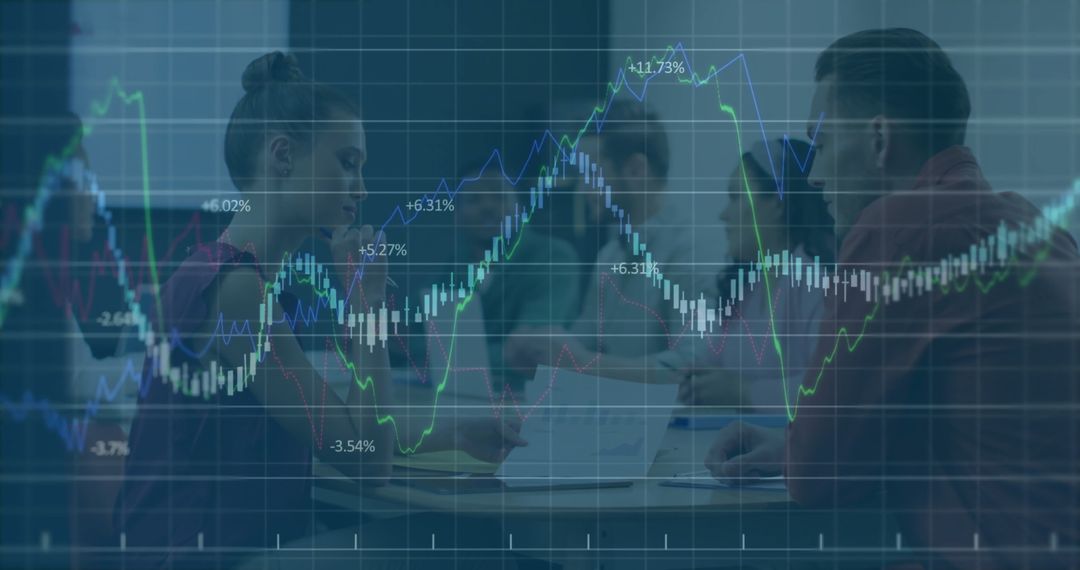
- Digital Financial Data Trends and Analytics Conceptual Background
Digital Financial Data Trends and Analytics Conceptual Background Image

Abstract depiction of financial data and trends overlaid on office setting. Useful for backgrounds in presentations related to analytics, financial reports, economic analysis, or business technology demonstrations. Engages audience in topics of business decision-making and global financial market movements.
Powered by  - Get 15% off with code: PIKWIZARD15


2
downloads
downloads
Tags:
More
Credit Photo
If you would like to credit the Photo, here are some ways you can do so
Text Link
photo Link
<span class="text-link">
<span>
<a target="_blank" href=https://pikwizard.com/photo/digital-financial-data-trends-and-analytics-conceptual-background/a3b4a776e8f763f293e1e6ebc3b6b992/>PikWizard</a>
</span>
</span>
<span class="image-link">
<span
style="margin: 0 0 20px 0; display: inline-block; vertical-align: middle; width: 100%;"
>
<a
target="_blank"
href="https://pikwizard.com/photo/digital-financial-data-trends-and-analytics-conceptual-background/a3b4a776e8f763f293e1e6ebc3b6b992/"
style="text-decoration: none; font-size: 10px; margin: 0;"
>
<img src="https://pikwizard.com/pw/medium/a3b4a776e8f763f293e1e6ebc3b6b992.jpg" style="margin: 0; width: 100%;" alt="" />
<p style="font-size: 12px; margin: 0;">PikWizard</p>
</a>
</span>
</span>
Free (free of charge)
Free for personal and commercial use.
Author: Awesome Content
Similar Free Stock Images

Premium


Premium


Premium


Premium


Premium


Premium


Premium


Premium


Premium


Premium


Premium


Premium


Premium


Premium


Premium


Premium


Premium


Premium


Premium


Premium


Premium


Premium


Premium


Premium

