- Home >
- Stock Photos >
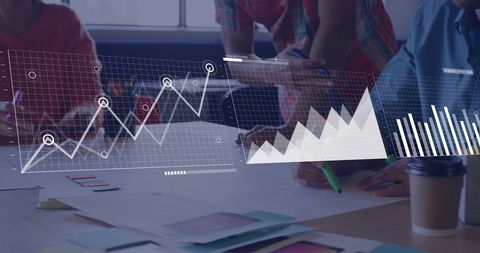
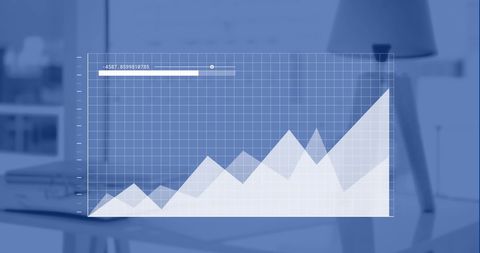
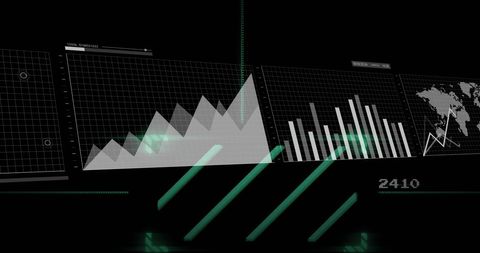
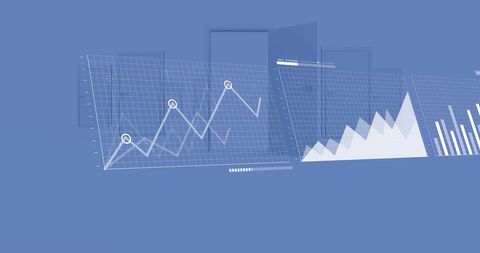
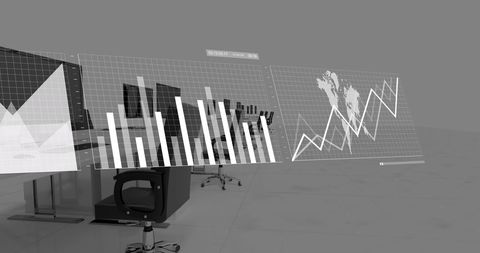
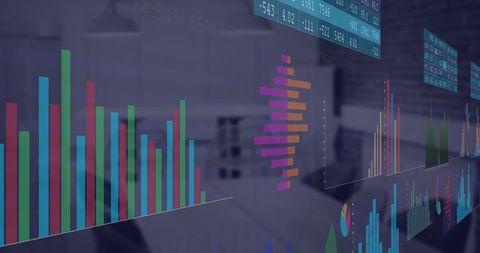
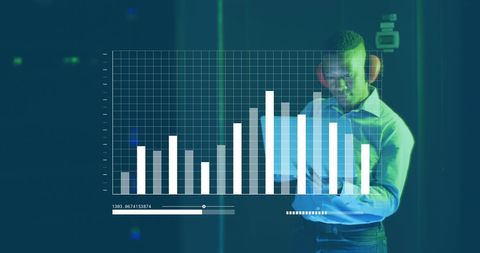
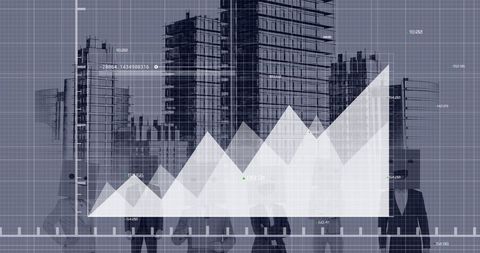
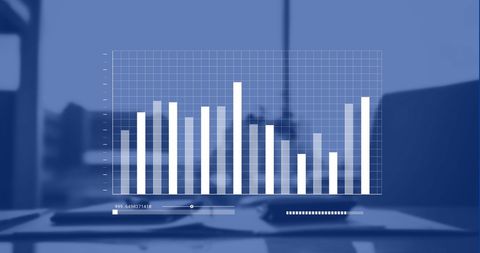
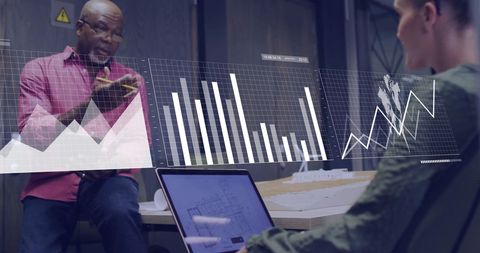
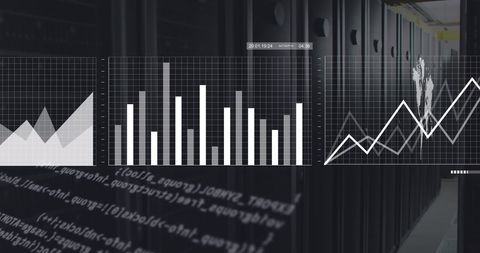
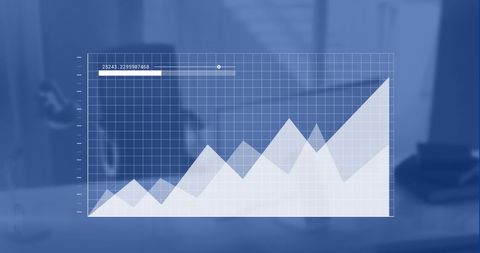
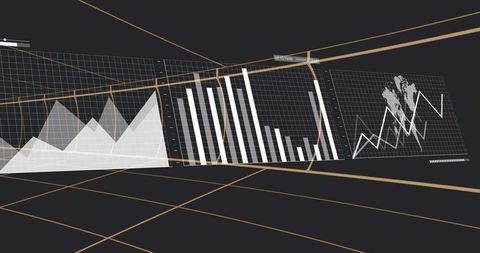
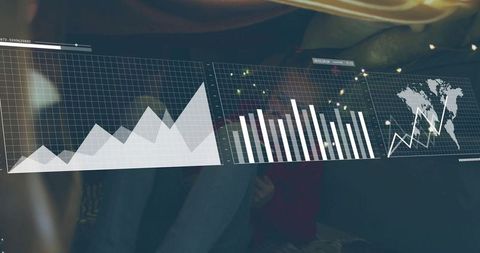
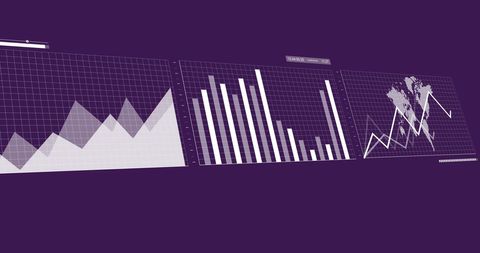
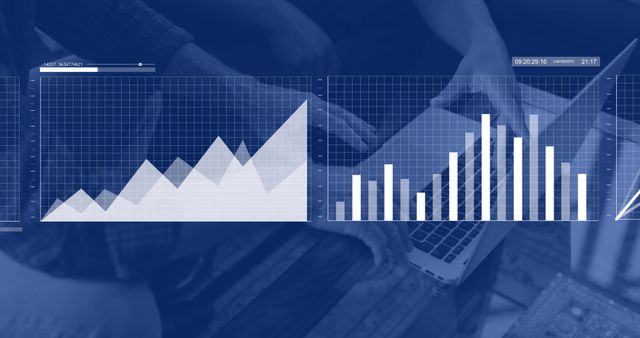
- Digital Financial Data Visualization Across Office Desk
Digital Financial Data Visualization Across Office Desk Image

This depiction of virtual financial charts overlaying an office desk showcases digital integration of data and analytics in global finance. Suitable for illustrating complex data processing, business reports, and financial sector innovations. Ideal for use in presentations, business plans, or informative blog posts about finance and data analysis.

downloads
Tags:
More
Credit Photo
If you would like to credit the Photo, here are some ways you can do so
Text Link
photo Link
<span class="text-link">
<span>
<a target="_blank" href=https://pikwizard.com/photo/digital-financial-data-visualization-across-office-desk/9a1229a90ecf9fced6e7145ef63b5e09/>PikWizard</a>
</span>
</span>
<span class="image-link">
<span
style="margin: 0 0 20px 0; display: inline-block; vertical-align: middle; width: 100%;"
>
<a
target="_blank"
href="https://pikwizard.com/photo/digital-financial-data-visualization-across-office-desk/9a1229a90ecf9fced6e7145ef63b5e09/"
style="text-decoration: none; font-size: 10px; margin: 0;"
>
<img src="https://pikwizard.com/pw/medium/9a1229a90ecf9fced6e7145ef63b5e09.jpg" style="margin: 0; width: 100%;" alt="" />
<p style="font-size: 12px; margin: 0;">PikWizard</p>
</a>
</span>
</span>
Free (free of charge)
Free for personal and commercial use.
Author: People Creations