- Home >
- Stock Photos >
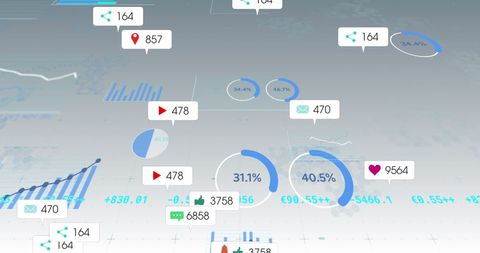
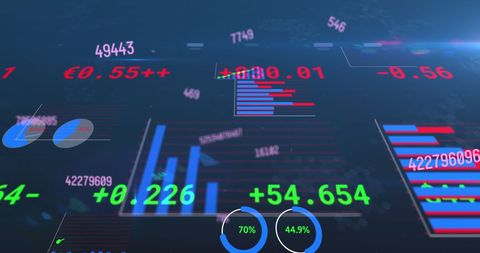
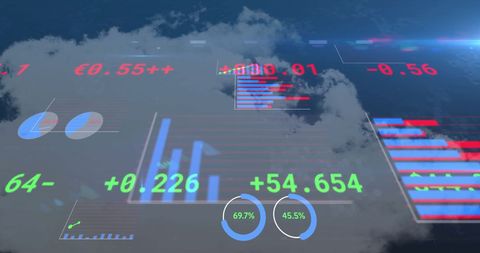
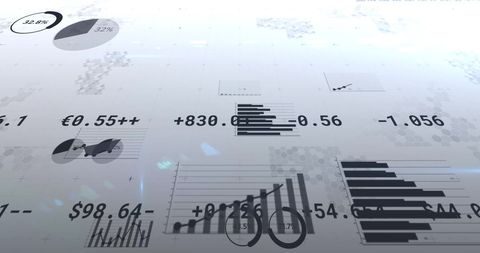
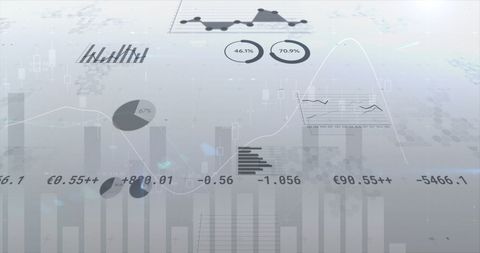
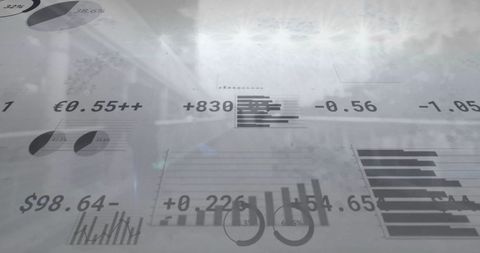
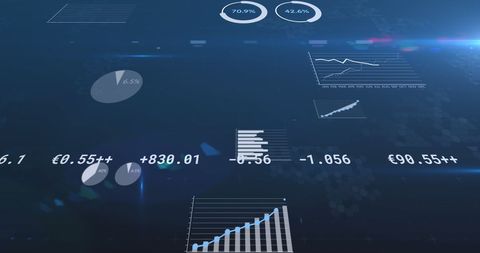
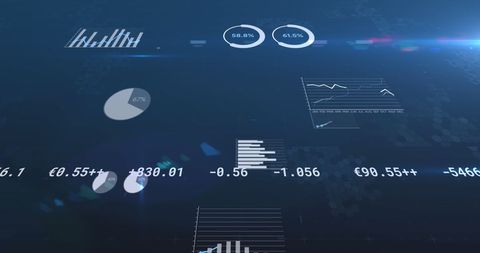
- Digital Financial Data Visualization Background with Charts
Digital Financial Data Visualization Background with Charts Image
Showcasing various financial data and charts in a digital interface style, perfect for use in presentations, reports, or advertising related to finance, data analytics, technology, or any business-centric content requiring a modern and technical look. Background adds a professional and digitalized appearance to financial discussions.

downloads
Tags:
More
Credit Photo
If you would like to credit the Photo, here are some ways you can do so
Text Link
photo Link
<span class="text-link">
<span>
<a target="_blank" href=https://pikwizard.com/photo/digital-financial-data-visualization-background-with-charts/228be52062a352207059b30fce5aaaa5/>PikWizard</a>
</span>
</span>
<span class="image-link">
<span
style="margin: 0 0 20px 0; display: inline-block; vertical-align: middle; width: 100%;"
>
<a
target="_blank"
href="https://pikwizard.com/photo/digital-financial-data-visualization-background-with-charts/228be52062a352207059b30fce5aaaa5/"
style="text-decoration: none; font-size: 10px; margin: 0;"
>
<img src="https://pikwizard.com/pw/medium/228be52062a352207059b30fce5aaaa5.jpg" style="margin: 0; width: 100%;" alt="" />
<p style="font-size: 12px; margin: 0;">PikWizard</p>
</a>
</span>
</span>
Free (free of charge)
Free for personal and commercial use.
Author: Awesome Content