
- Home >
- Stock Photos >
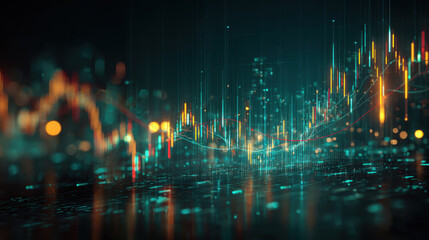
- Digital Financial Data Visualization on Dark Screen
Digital Financial Data Visualization on Dark Screen Image

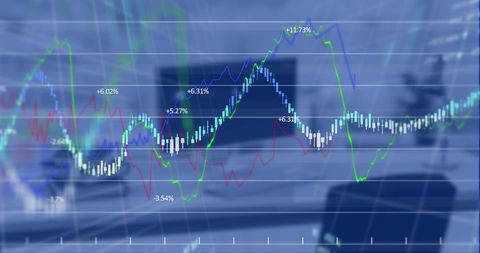
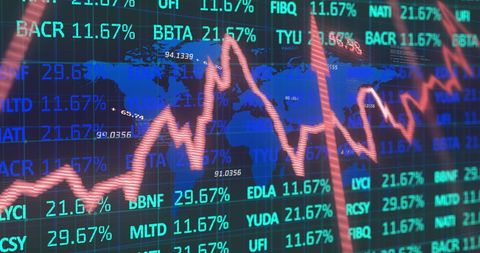
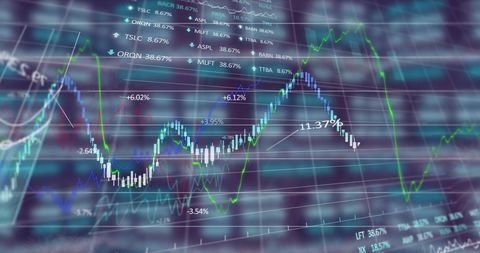
Digital representation of financial data and stock market trends shown on a dark background, highlighting complex economic activities. Suitable for use in business presentations, financial consulting reports, and educational materials related to global economic trends and market analysis.
Powered by 


downloads
Tags:
More
Credit Photo
If you would like to credit the Photo, here are some ways you can do so
Text Link
photo Link
<span class="text-link">
<span>
<a target="_blank" href=https://pikwizard.com/photo/digital-financial-data-visualization-on-dark-screen/2a5d668bf3debe531493cfa16a8fecd7/>PikWizard</a>
</span>
</span>
<span class="image-link">
<span
style="margin: 0 0 20px 0; display: inline-block; vertical-align: middle; width: 100%;"
>
<a
target="_blank"
href="https://pikwizard.com/photo/digital-financial-data-visualization-on-dark-screen/2a5d668bf3debe531493cfa16a8fecd7/"
style="text-decoration: none; font-size: 10px; margin: 0;"
>
<img src="https://pikwizard.com/pw/medium/2a5d668bf3debe531493cfa16a8fecd7.jpg" style="margin: 0; width: 100%;" alt="" />
<p style="font-size: 12px; margin: 0;">PikWizard</p>
</a>
</span>
</span>
Free (free of charge)
Free for personal and commercial use.
Author: Authentic Images
Similar Free Stock Images

Premium

Premium

Premium


Premium


Premium
Premium


Premium
Premium


Premium


Premium


Premium


Premium


Premium


Premium


Premium


Premium


Premium


Premium

Premium


Premium


Premium


Premium


Premium

Premium


Premium


Explore More Free Stock Images