
- Home >
- Stock Photos >
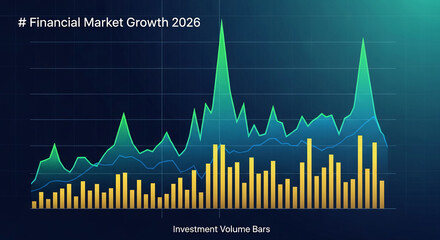
- Digital Financial Data Visualization on Grid Display
Digital Financial Data Visualization on Grid Display Image

This image displays financial data visualized on a digital grid backdrop, featuring graphs and fluctuating numbers. It is ideal for illustrating articles on global finance, investment strategies, or economic analysis. Use it in presentations about stock market behaviors or data analytics in business contexts.
Powered by 


downloads
Tags:
More
Credit Photo
If you would like to credit the Photo, here are some ways you can do so
Text Link
photo Link
<span class="text-link">
<span>
<a target="_blank" href=https://pikwizard.com/photo/digital-financial-data-visualization-on-grid-display/748d0df50b104c917e7a4edb856619c4/>PikWizard</a>
</span>
</span>
<span class="image-link">
<span
style="margin: 0 0 20px 0; display: inline-block; vertical-align: middle; width: 100%;"
>
<a
target="_blank"
href="https://pikwizard.com/photo/digital-financial-data-visualization-on-grid-display/748d0df50b104c917e7a4edb856619c4/"
style="text-decoration: none; font-size: 10px; margin: 0;"
>
<img src="https://pikwizard.com/pw/medium/748d0df50b104c917e7a4edb856619c4.jpg" style="margin: 0; width: 100%;" alt="" />
<p style="font-size: 12px; margin: 0;">PikWizard</p>
</a>
</span>
</span>
Free (free of charge)
Free for personal and commercial use.
Author: Authentic Images
Similar Free Stock Images

Premium


Premium

Premium


Premium


Premium


Premium

Premium


Premium


Premium


Premium


Premium


Premium


Premium


Premium


Premium


Premium


Premium


Premium


Premium


Premium


Premium


Premium


Premium


Premium


Premium


Explore More Free Stock Images