- Home >
- Stock Photos >
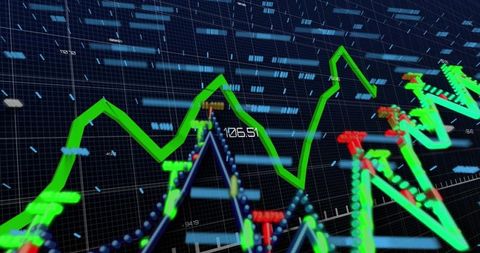
- Digital Financial Data Visualization on Technological Grid
Digital Financial Data Visualization on Technological Grid Image

Dynamic visualization displaying financial data typifies cutting-edge analytics on a complex digital grid. With a series of graphs and numerical data provoking notions of sophisticated, real-time economic tracking and business decisions, it caters primarily to financial investments or market forecasting contexts. Enterprises may use this idea in illustrations highlighting analytical processes or STEM educational tools to indicate the impact of technology August thanponentsep ingressisticated business analyses.

downloads
Tags:
More
Credit Photo
If you would like to credit the Photo, here are some ways you can do so
Text Link
photo Link
<span class="text-link">
<span>
<a target="_blank" href=https://pikwizard.com/photo/digital-financial-data-visualization-on-technological-grid/8a3fcb7dacda3cf8e628d50f1949fa1e/>PikWizard</a>
</span>
</span>
<span class="image-link">
<span
style="margin: 0 0 20px 0; display: inline-block; vertical-align: middle; width: 100%;"
>
<a
target="_blank"
href="https://pikwizard.com/photo/digital-financial-data-visualization-on-technological-grid/8a3fcb7dacda3cf8e628d50f1949fa1e/"
style="text-decoration: none; font-size: 10px; margin: 0;"
>
<img src="https://pikwizard.com/pw/medium/8a3fcb7dacda3cf8e628d50f1949fa1e.jpg" style="margin: 0; width: 100%;" alt="" />
<p style="font-size: 12px; margin: 0;">PikWizard</p>
</a>
</span>
</span>
Free (free of charge)
Free for personal and commercial use.
Author: People Creations