
- Home >
- Stock Photos >
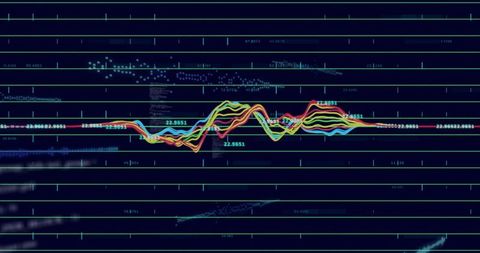
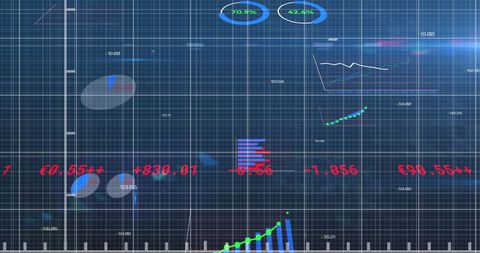
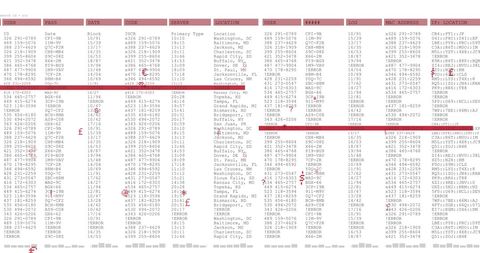
- Digital Financial Data Visualization on Transparent Interface
Digital Financial Data Visualization on Transparent Interface Image

This image is useful for illustrating modern financial analytics, showcasing advanced technology for corporate presentations, reports, and articles focused on economic trends and digital transformation. Perfect for depicting concepts in fintech, investment research, and market analysis tools.
Powered by  - Get 15% off with code: PIKWIZARD15


downloads
Tags:
More
Credit Photo
If you would like to credit the Photo, here are some ways you can do so
Text Link
photo Link
<span class="text-link">
<span>
<a target="_blank" href=https://pikwizard.com/photo/digital-financial-data-visualization-on-transparent-interface/b4884c57e877ca369dc5c257555a9a1d/>PikWizard</a>
</span>
</span>
<span class="image-link">
<span
style="margin: 0 0 20px 0; display: inline-block; vertical-align: middle; width: 100%;"
>
<a
target="_blank"
href="https://pikwizard.com/photo/digital-financial-data-visualization-on-transparent-interface/b4884c57e877ca369dc5c257555a9a1d/"
style="text-decoration: none; font-size: 10px; margin: 0;"
>
<img src="https://pikwizard.com/pw/medium/b4884c57e877ca369dc5c257555a9a1d.jpg" style="margin: 0; width: 100%;" alt="" />
<p style="font-size: 12px; margin: 0;">PikWizard</p>
</a>
</span>
</span>
Free (free of charge)
Free for personal and commercial use.
Author: People Creations
Similar Free Stock Images
Premium


Premium


Premium


Premium

Premium


Premium

AI


Premium


Premium

Premium


Premium


Premium


Premium


Premium


Premium


Premium


Premium


Premium


Premium


Premium


Premium

Premium

Premium


Premium

Premium


Premium


Explore More Free Stock Images