- Home >
- Stock Photos >
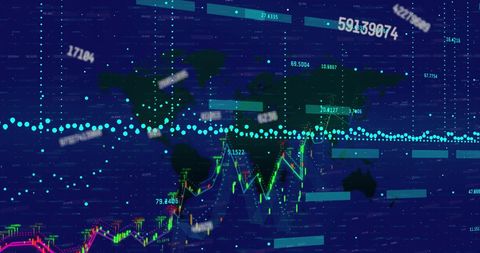
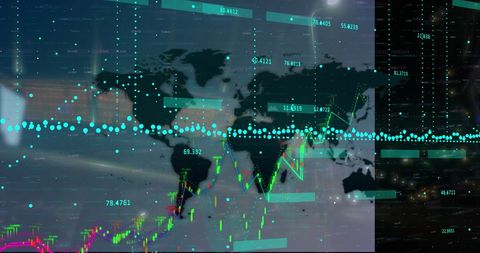
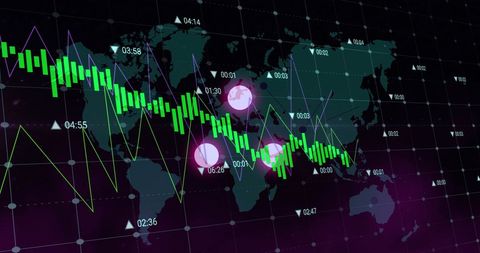
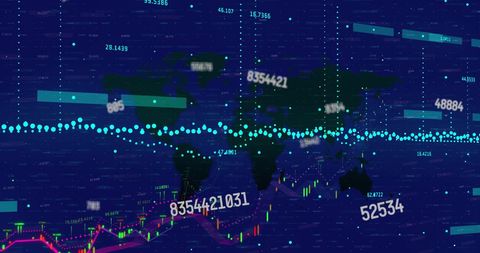
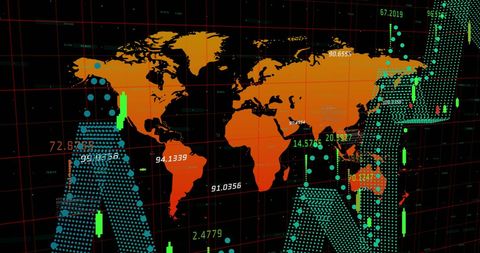
- Digital Financial Data Visualization on World Map
Digital Financial Data Visualization on World Map Image

Visual representation of global financial data processing with overlaid digital charts on a world map. Icons and graphs indicate various financial trends and analysis, ideal for illustrating concepts in global finance, technological advancements in fintech, and international market analytics. Useful for articles, presentations, and educational material in economics and financial technologies.

downloads
Tags:
More
Credit Photo
If you would like to credit the Photo, here are some ways you can do so
Text Link
photo Link
<span class="text-link">
<span>
<a target="_blank" href=https://pikwizard.com/photo/digital-financial-data-visualization-on-world-map/57048f435c47856afdb6c773e9f4fb2b/>PikWizard</a>
</span>
</span>
<span class="image-link">
<span
style="margin: 0 0 20px 0; display: inline-block; vertical-align: middle; width: 100%;"
>
<a
target="_blank"
href="https://pikwizard.com/photo/digital-financial-data-visualization-on-world-map/57048f435c47856afdb6c773e9f4fb2b/"
style="text-decoration: none; font-size: 10px; margin: 0;"
>
<img src="https://pikwizard.com/pw/medium/57048f435c47856afdb6c773e9f4fb2b.jpg" style="margin: 0; width: 100%;" alt="" />
<p style="font-size: 12px; margin: 0;">PikWizard</p>
</a>
</span>
</span>
Free (free of charge)
Free for personal and commercial use.
Author: Authentic Images