- Home >
- Stock Photos >
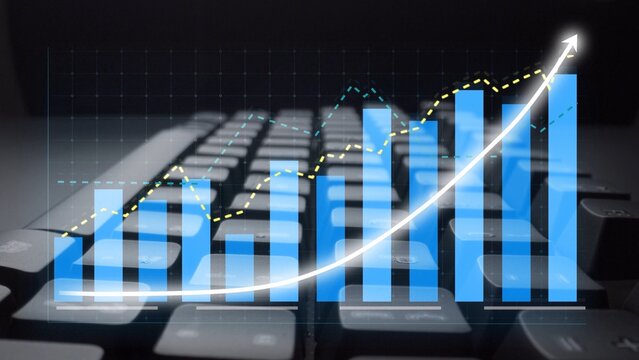
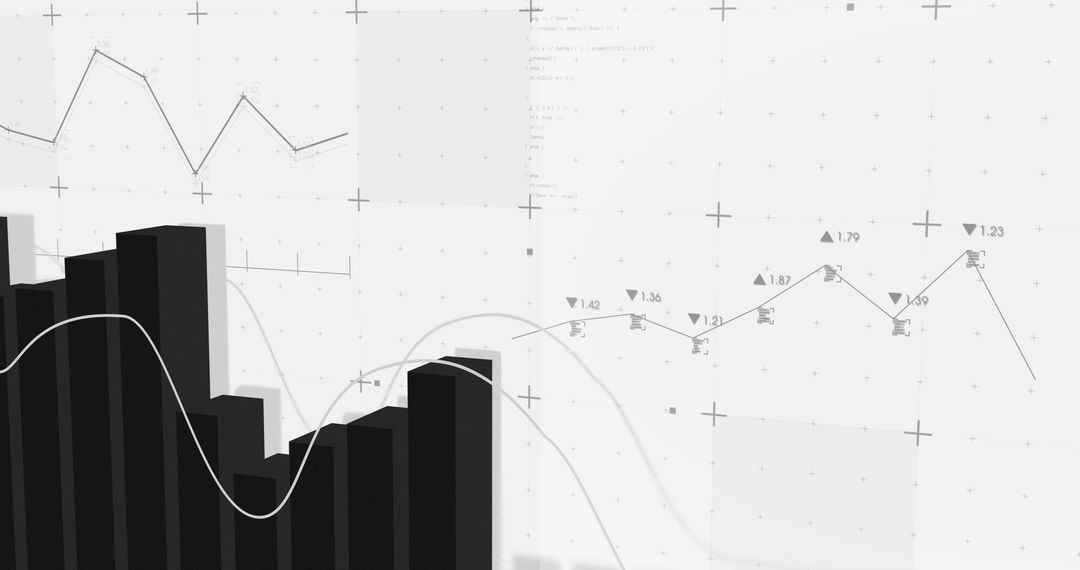
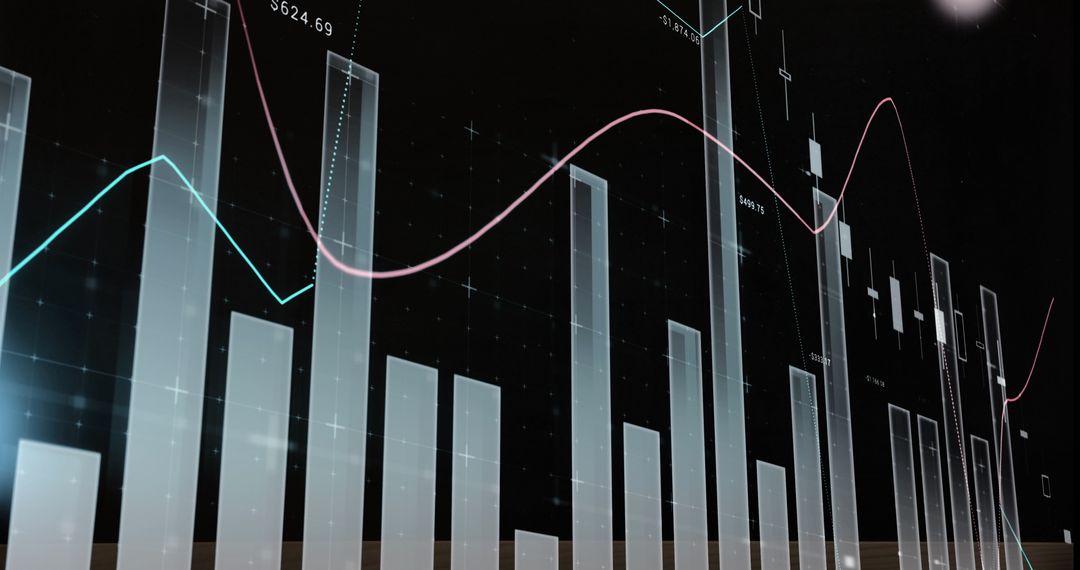
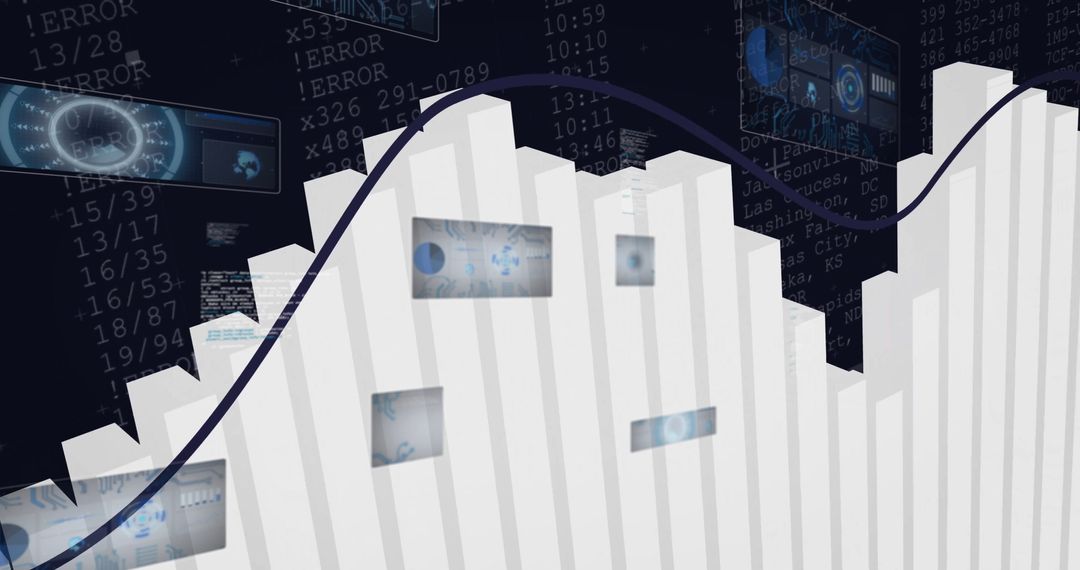
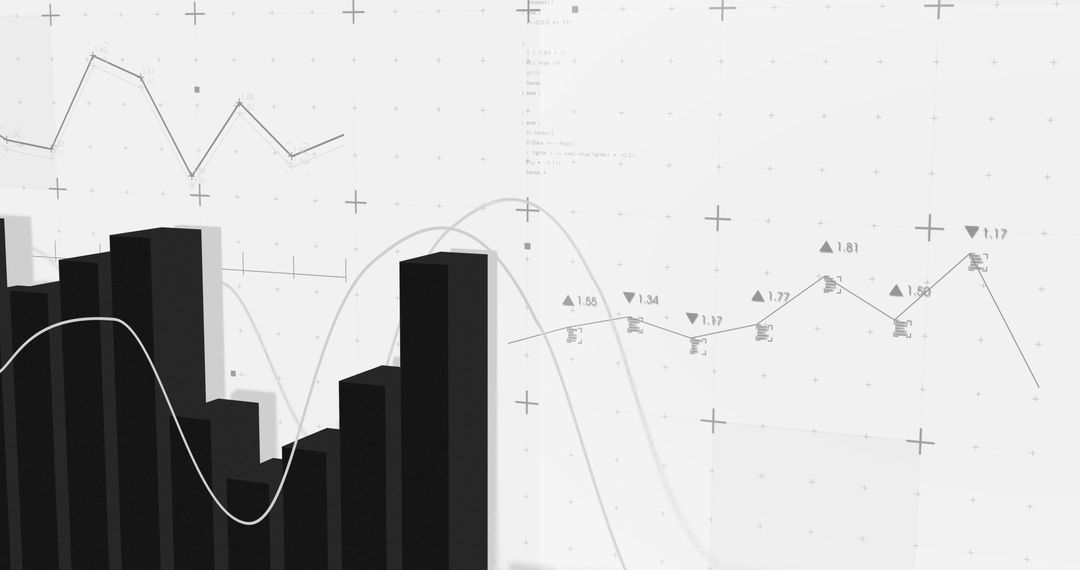
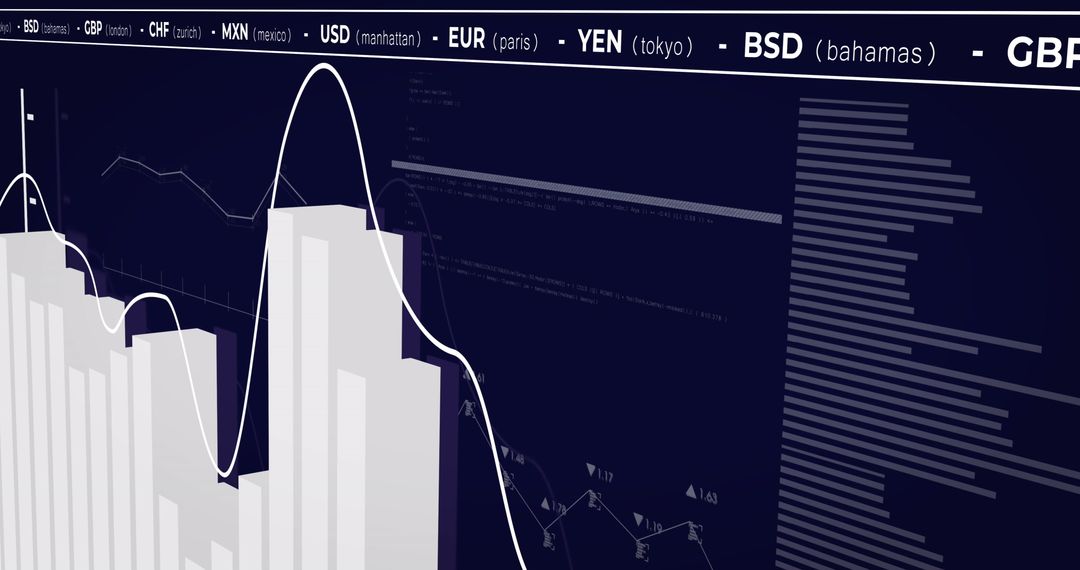
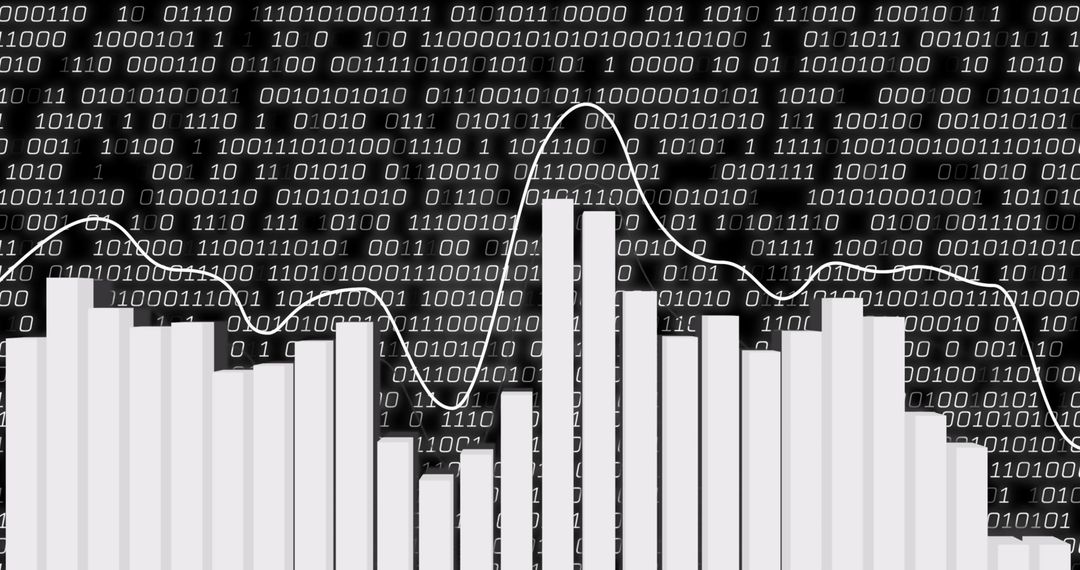
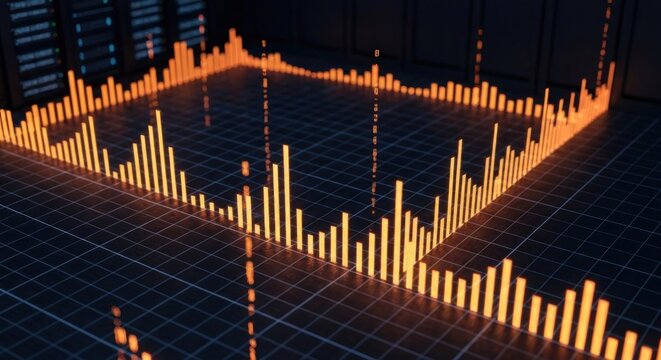
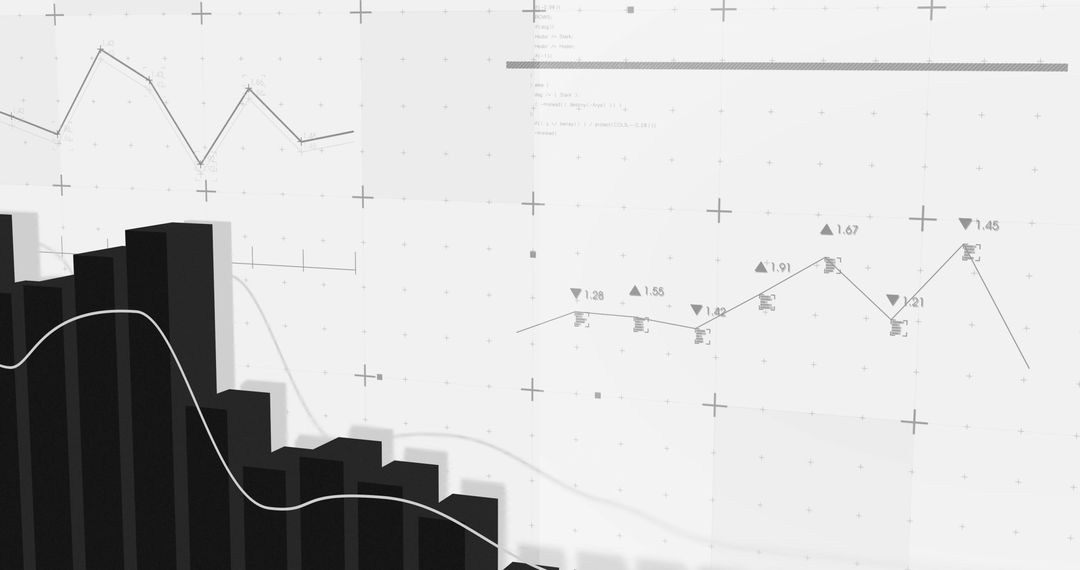
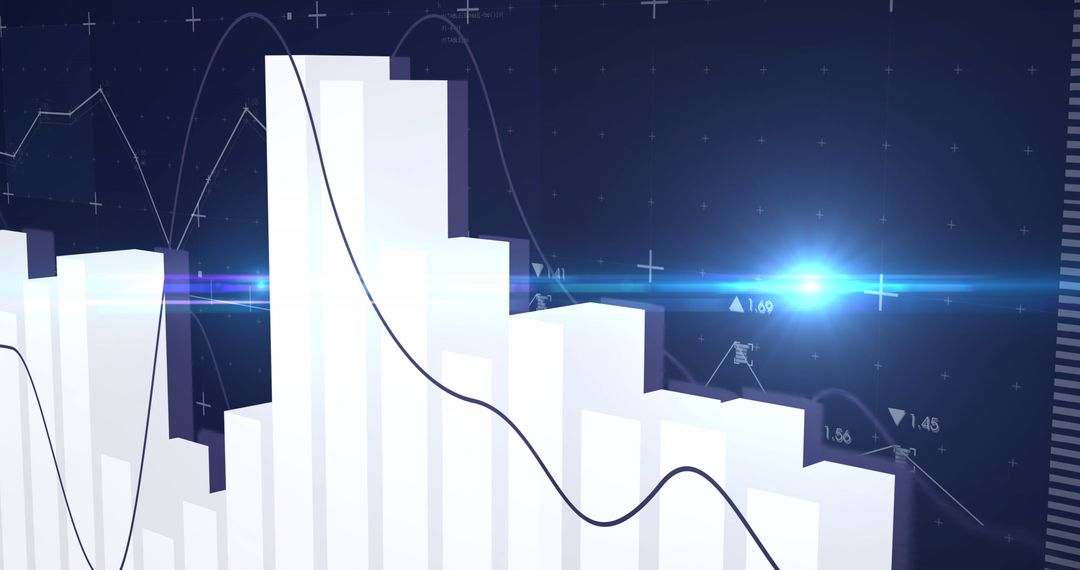
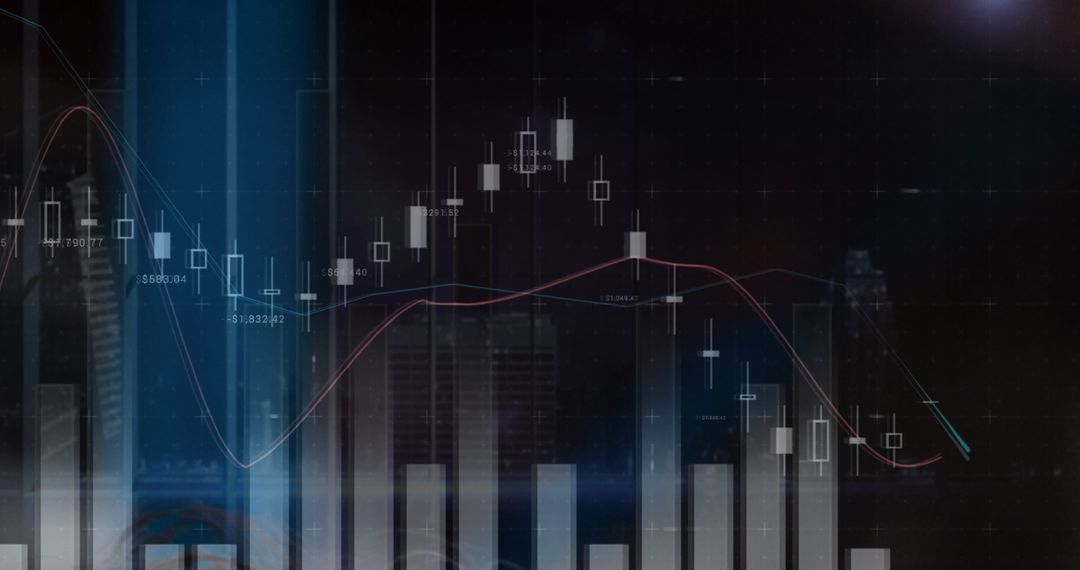
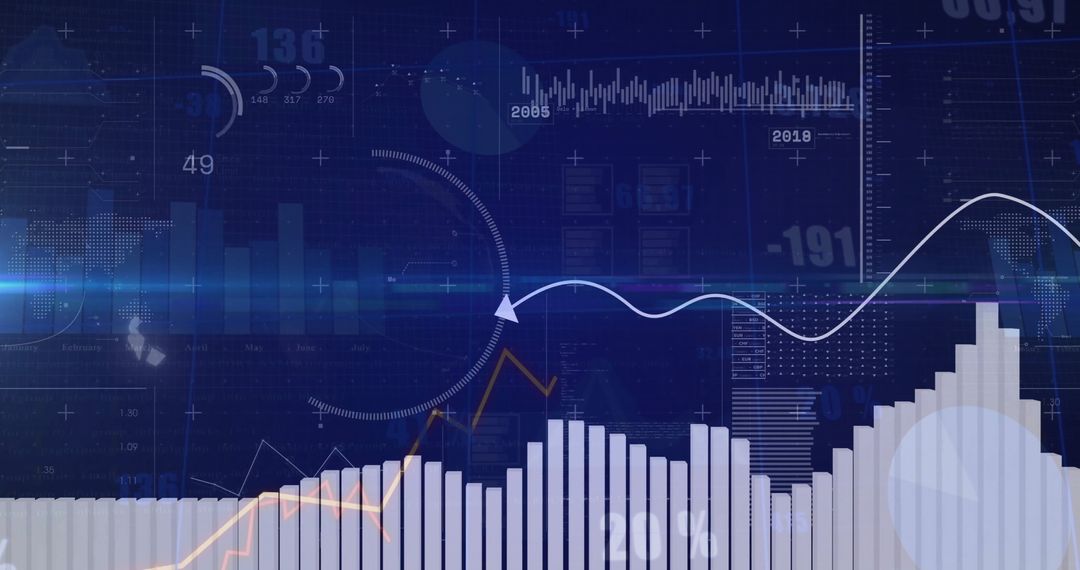
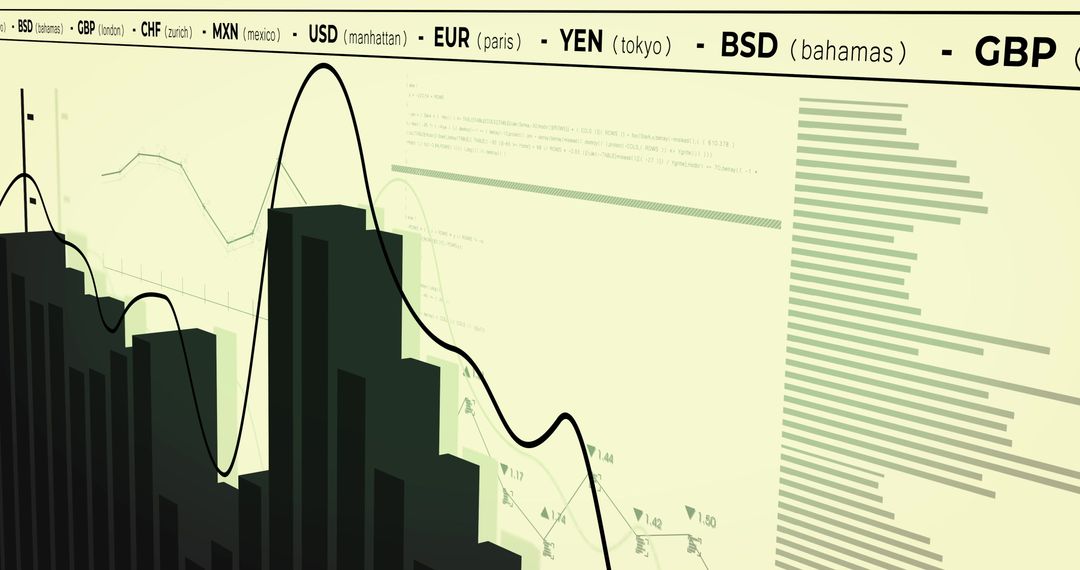
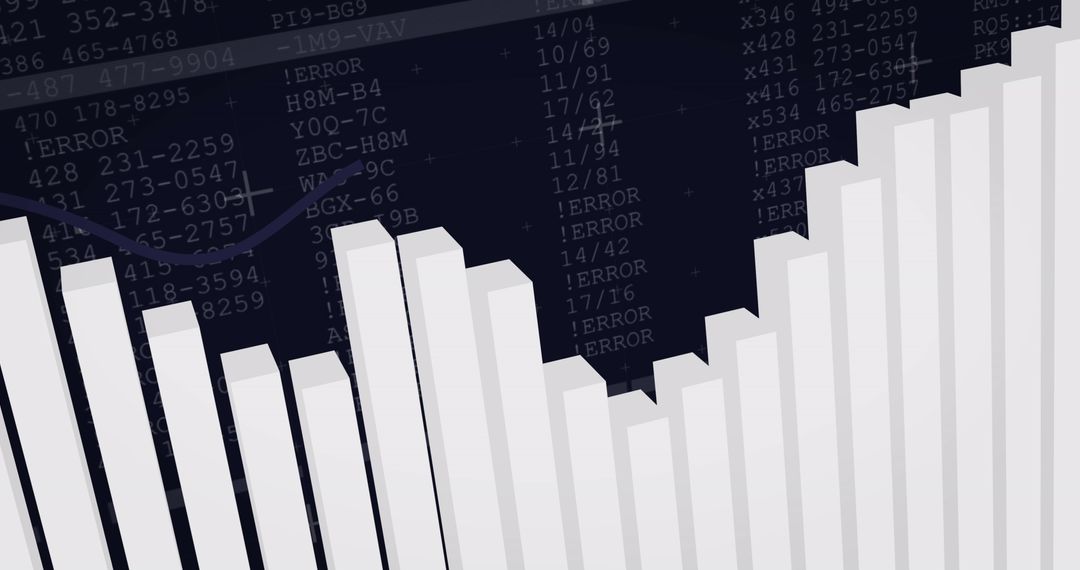
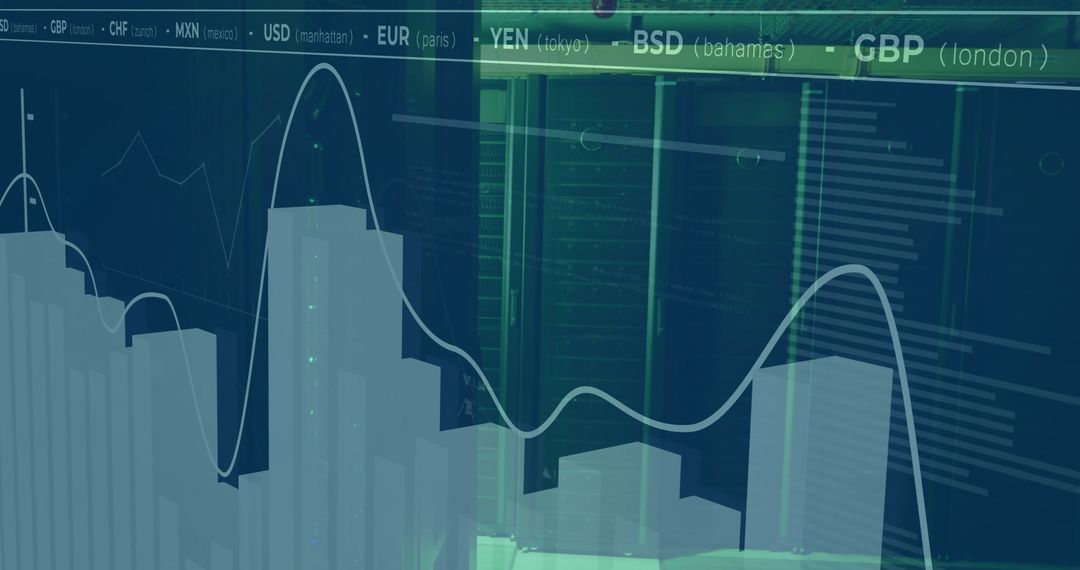
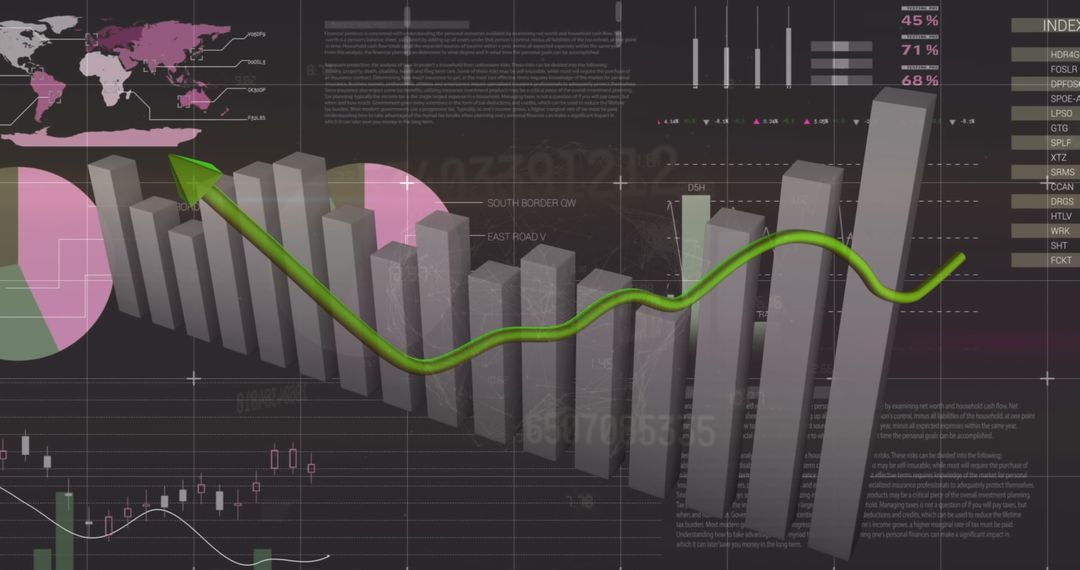
- Digital Financial Data Visualization with Bar and Line Graph
Digital Financial Data Visualization with Bar and Line Graph Image

Modern graphical representation of financial metrics blending bar and line elements over a dark digital interface backdrop, illustrating complex data analytics or financial forecasting. Perfect for reports, presentations, and articles related to finance, investment analysis, data science, econometrics or business strategies, serving as a powerful visual aid in engaging with both professional and academic audiences.
Powered by 


2
downloads
downloads
Tags:
More
Credit Photo
If you would like to credit the Photo, here are some ways you can do so
Text Link
photo Link
<span class="text-link">
<span>
<a target="_blank" href=https://pikwizard.com/photo/digital-financial-data-visualization-with-bar-and-line-graph/dffa4839e9ce1a1c084a663947944619/>PikWizard</a>
</span>
</span>
<span class="image-link">
<span
style="margin: 0 0 20px 0; display: inline-block; vertical-align: middle; width: 100%;"
>
<a
target="_blank"
href="https://pikwizard.com/photo/digital-financial-data-visualization-with-bar-and-line-graph/dffa4839e9ce1a1c084a663947944619/"
style="text-decoration: none; font-size: 10px; margin: 0;"
>
<img src="https://pikwizard.com/pw/medium/dffa4839e9ce1a1c084a663947944619.jpg" style="margin: 0; width: 100%;" alt="" />
<p style="font-size: 12px; margin: 0;">PikWizard</p>
</a>
</span>
</span>
Free (free of charge)
Free for personal and commercial use.
Author: Awesome Content
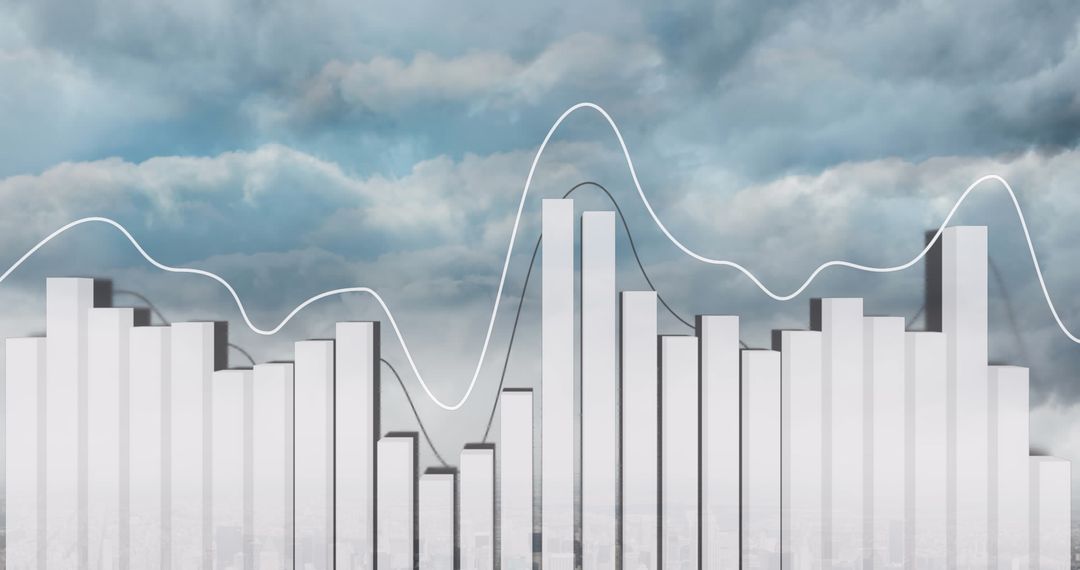
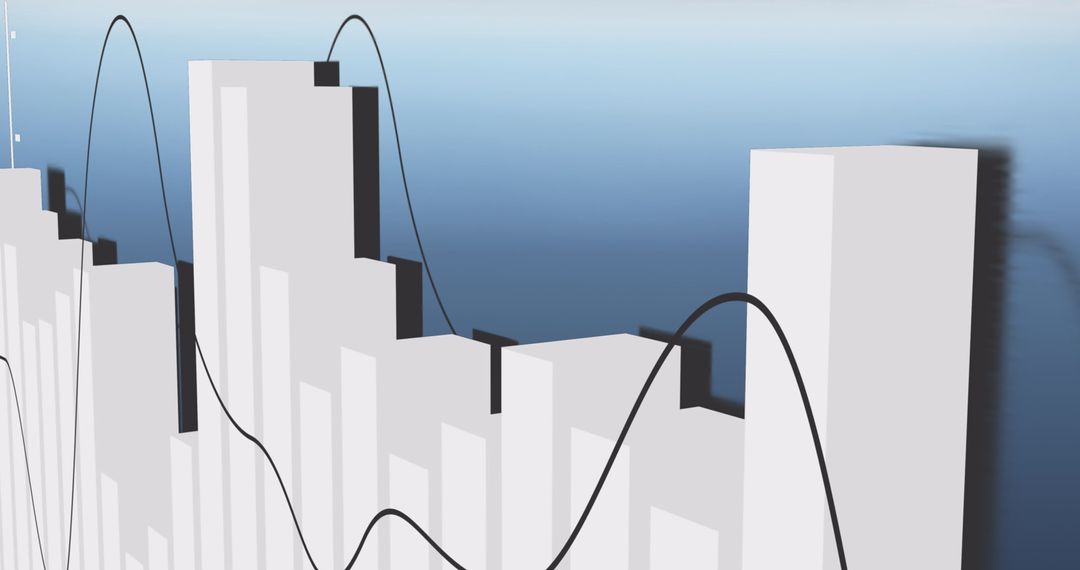
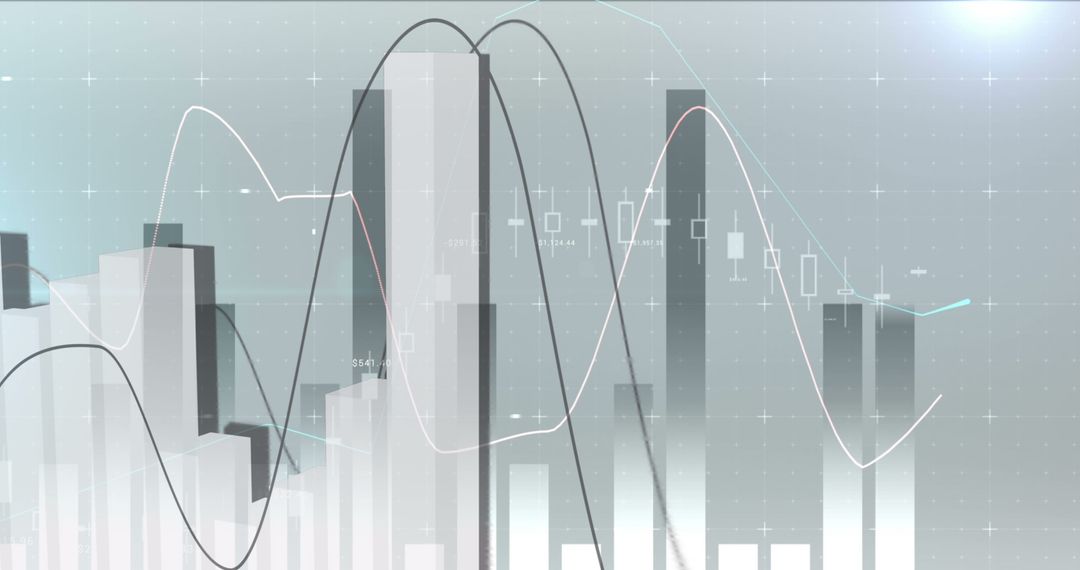
Similar Free Stock Images
Premium

Premium


Premium


Premium


Premium


Premium


Premium


Premium


Premium


Premium


Premium


Premium


Premium


Premium


Premium


Premium

Premium

Premium


Premium


Premium


Premium


Premium


Premium


Premium