
- Home >
- Stock Photos >
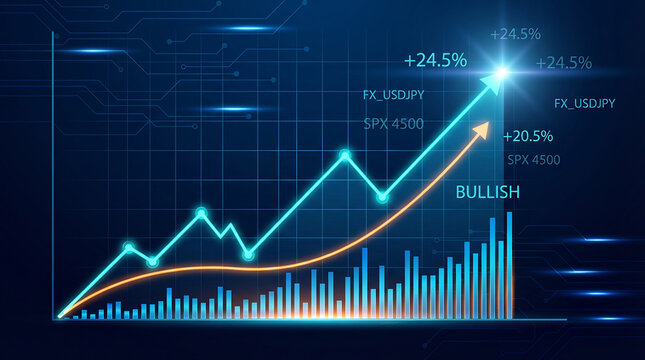
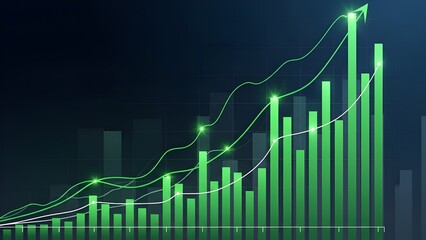
- Digital Financial Data Visualization with Bar Graphs and Line Charts
Digital Financial Data Visualization with Bar Graphs and Line Charts Image

Vibrant bar graphs and dynamic line charts illustrate financial data over a black background, representing technological advancement in global finance and business data processing. Ideal for projects related to stock market analysis, investment strategies, technology in finance, data visualization presentations, and business growth models.
Powered by 


downloads
Tags:
More
Credit Photo
If you would like to credit the Photo, here are some ways you can do so
Text Link
photo Link
<span class="text-link">
<span>
<a target="_blank" href=https://pikwizard.com/photo/digital-financial-data-visualization-with-bar-graphs-and-line-charts/8b7dc78af0186417f6010cdcd5ca63f6/>PikWizard</a>
</span>
</span>
<span class="image-link">
<span
style="margin: 0 0 20px 0; display: inline-block; vertical-align: middle; width: 100%;"
>
<a
target="_blank"
href="https://pikwizard.com/photo/digital-financial-data-visualization-with-bar-graphs-and-line-charts/8b7dc78af0186417f6010cdcd5ca63f6/"
style="text-decoration: none; font-size: 10px; margin: 0;"
>
<img src="https://pikwizard.com/pw/medium/8b7dc78af0186417f6010cdcd5ca63f6.jpg" style="margin: 0; width: 100%;" alt="" />
<p style="font-size: 12px; margin: 0;">PikWizard</p>
</a>
</span>
</span>
Free (free of charge)
Free for personal and commercial use.
Author: Authentic Images
Similar Free Stock Images

Premium


Premium

Premium


Premium


AI


Premium


Premium


Premium


Premium
Premium


Premium


Premium


Premium


Premium

Premium


Premium


Premium


Premium

Premium


Premium


Premium


Premium
Premium


Premium


Premium
Premium

Explore More Free Stock Images